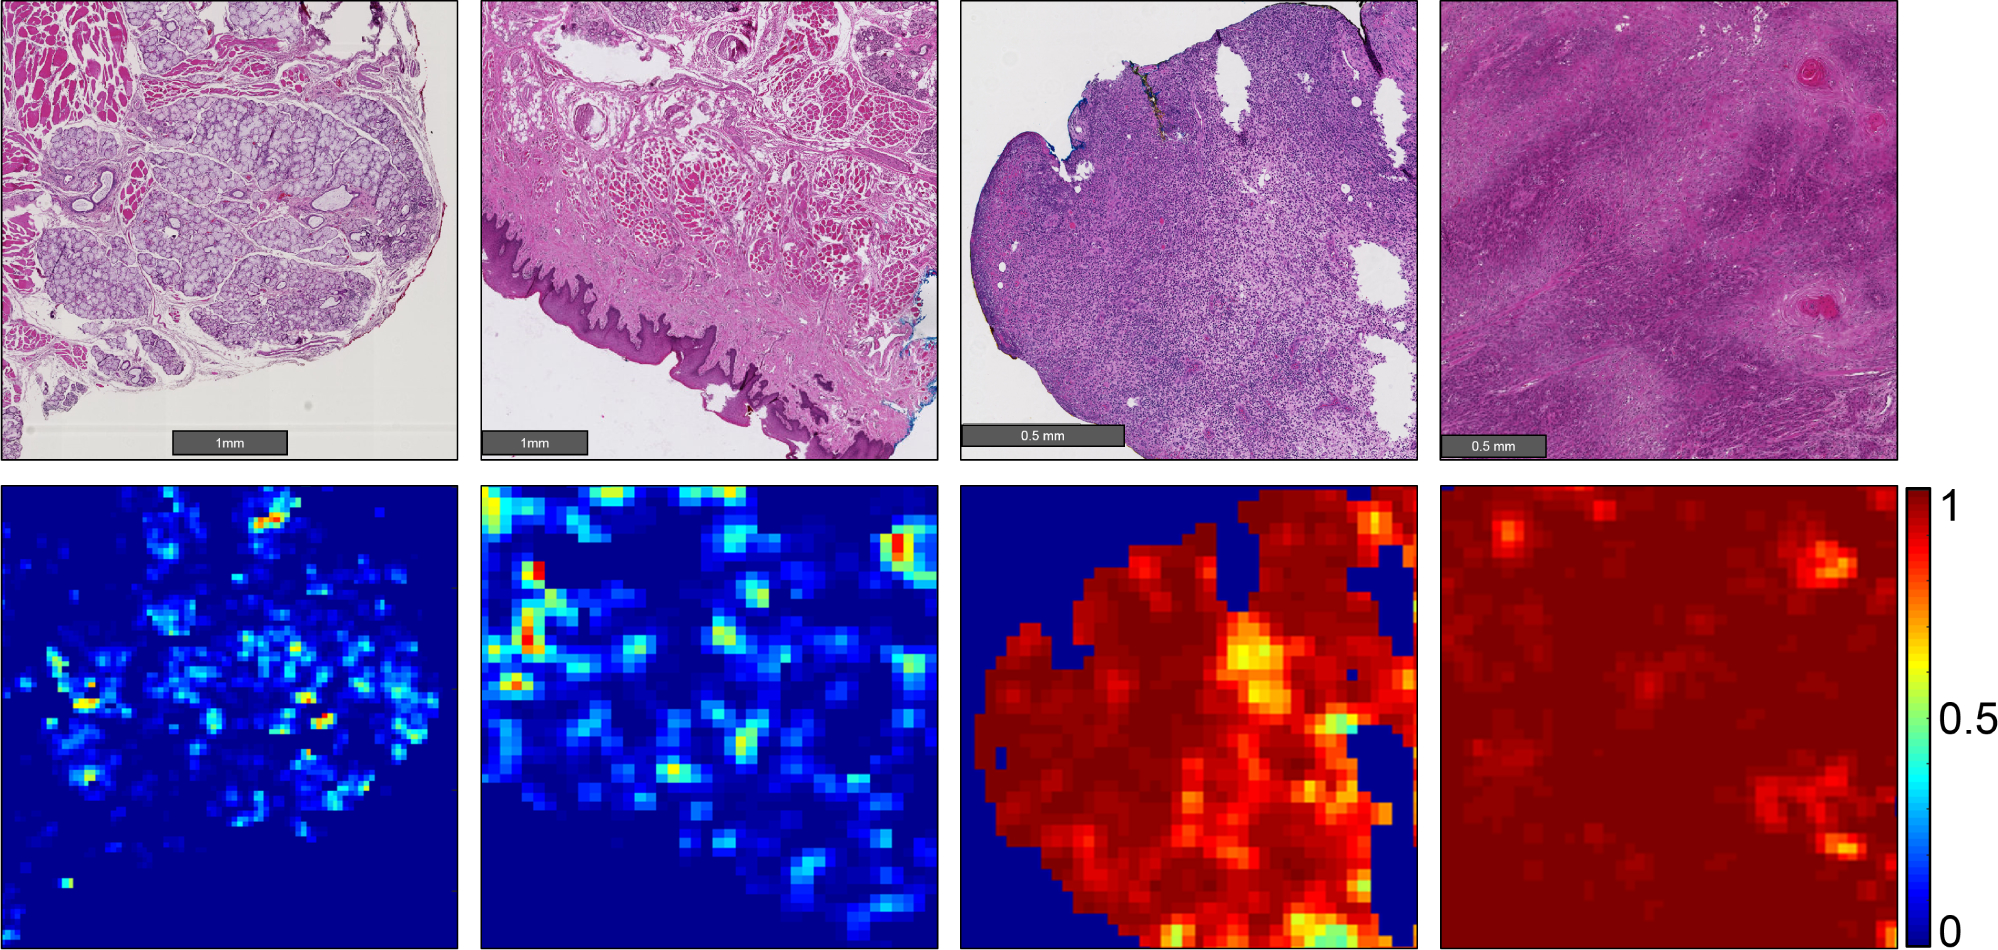
Figure 5:

Representative heat maps representing cancer probability of several regions of interest. From left to right, the CNN correctly identifies salivary gland and muscular components as having a low probability of SCC; stratified squamous epithelium correctly shown as a true negative; a false positive area representing inflammatory infiltration near the SCC border (not shown); correctly classified true positive SCC classified with high probability of SCC.
