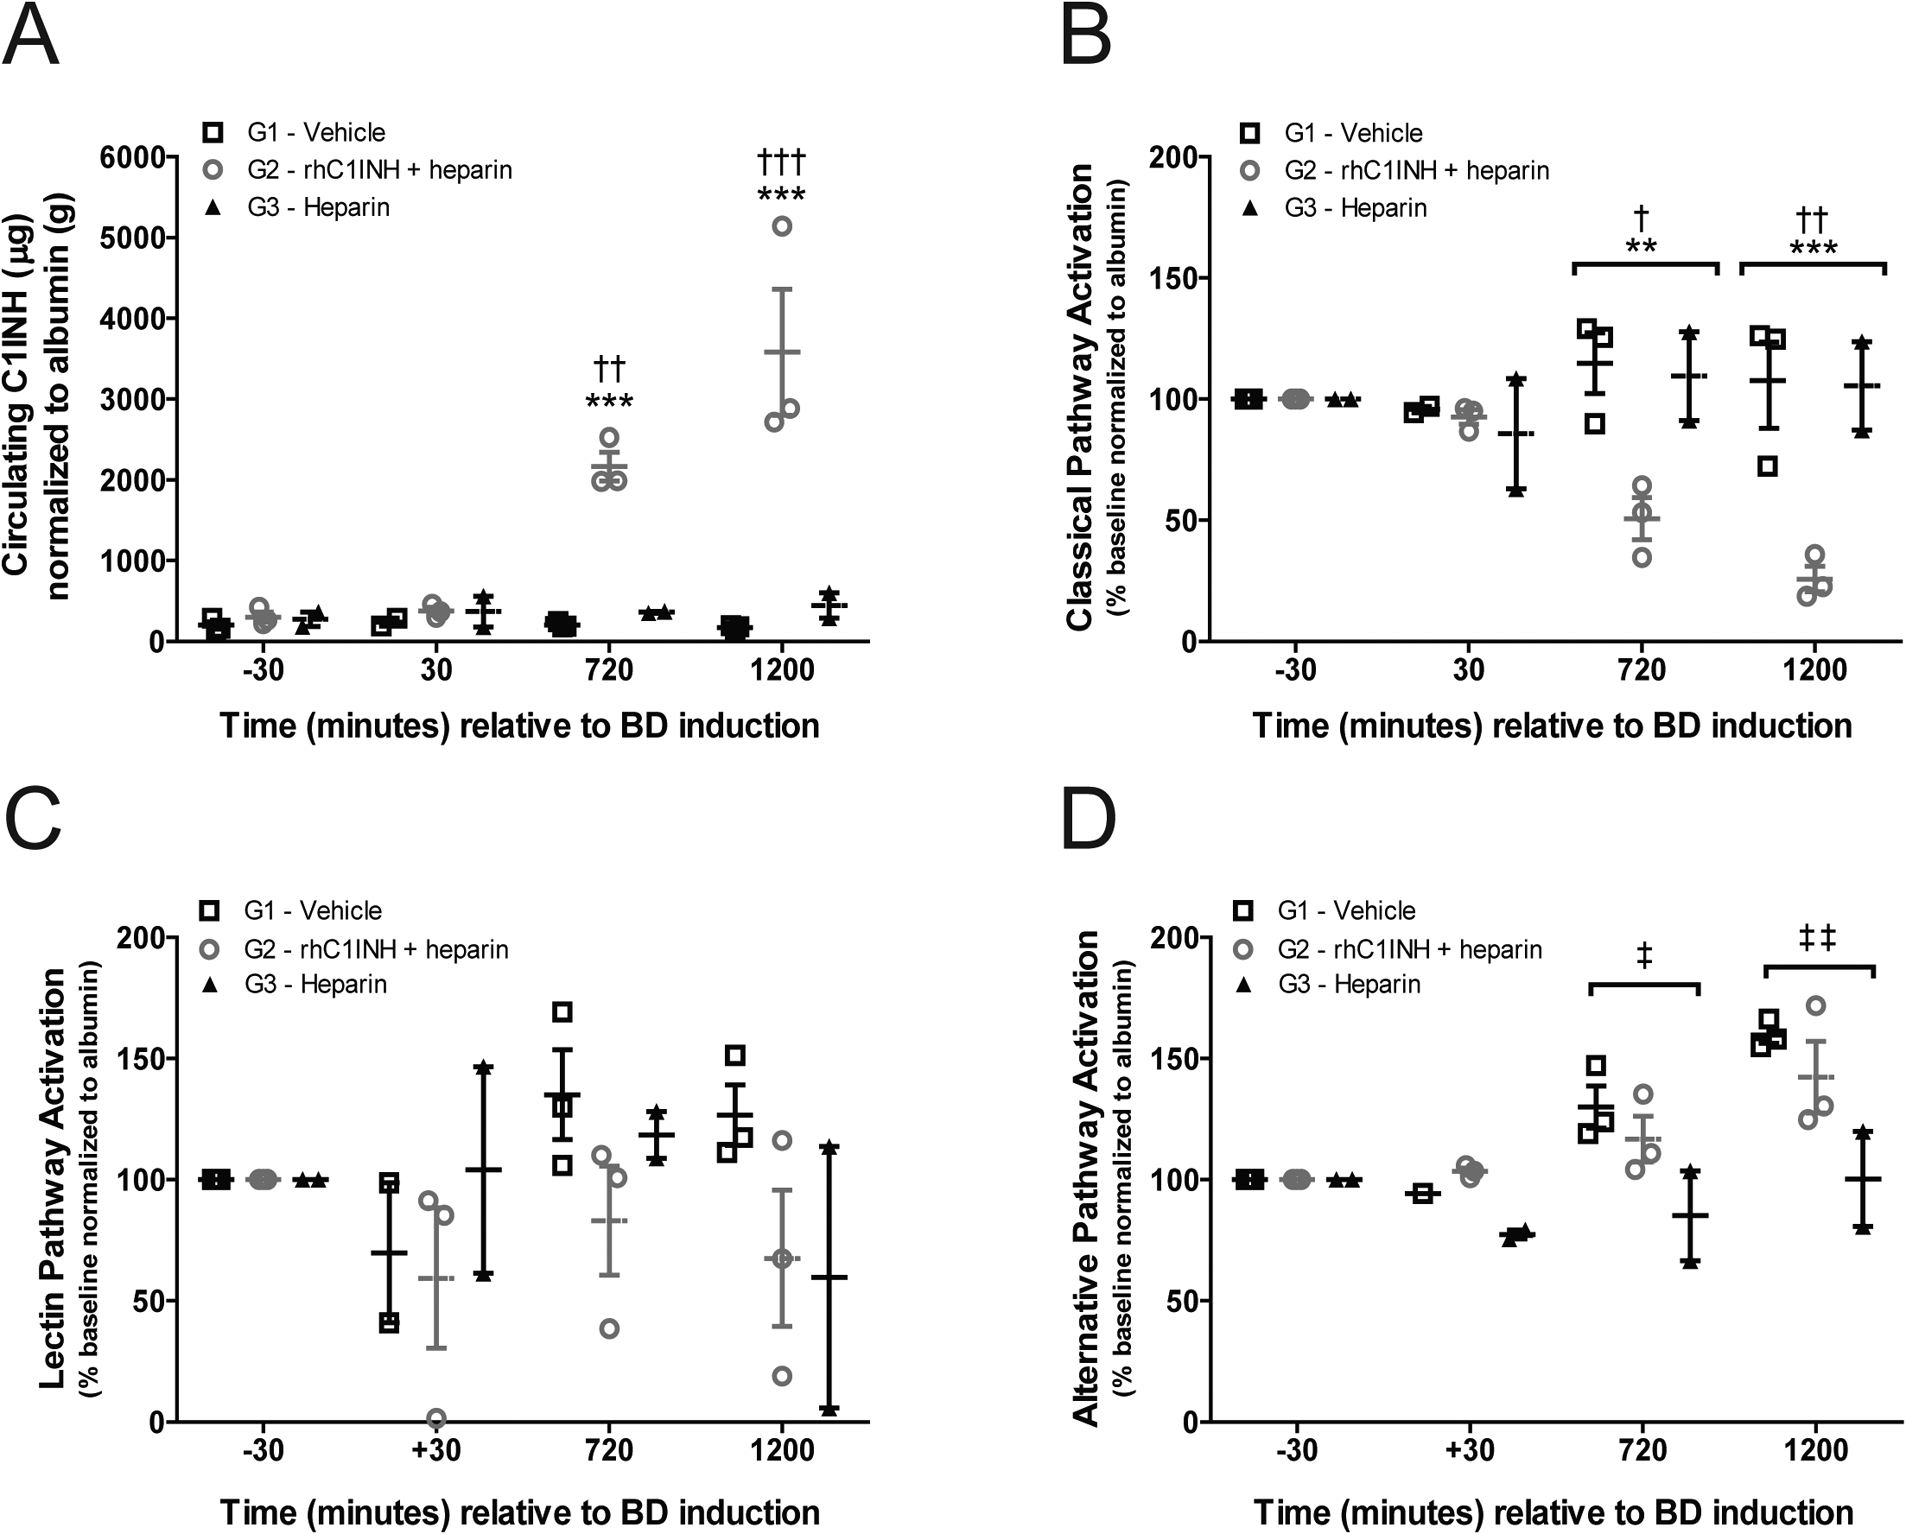
Figure 3. rhC1INH treatment results in sustained elevation of circulating C1INH and inhibits complement activation in the BD donor.

(a) Levels of serum C1INH in G1 (vehicle, n=3), G2 (rhC1INH+heparin, n=3), and G3 (heparin, n=2) donors at −30, 30, 720, and 1200 minutes relative to BD induction, five minutes after bolus injection of drug or vehicle where applicable. Data are presented as sample C1INH (μg) normalized to serum albumin (g) to compensate for dilution effects. (b-d) Complement activation determined by the complement system screen assay of the (b) CP, (c) LP, and (d) AP in G1, G2 and G3 donors. Data are expressed as percent activation normalized to albumin, relative to baseline (30 minutes before induction of BD). Data in a – d presented as mean values ±SEM, significance calculated by two-way ANOVA and Bonferroni’s post-hoc correction (**p<0.01 G1 vs G2; ***p<0.001 G1 vs G2; †p<0.05 G2 vs G3; ††p<0.01 G2 vs G3; †††p<0.001 G2 vs G3).
