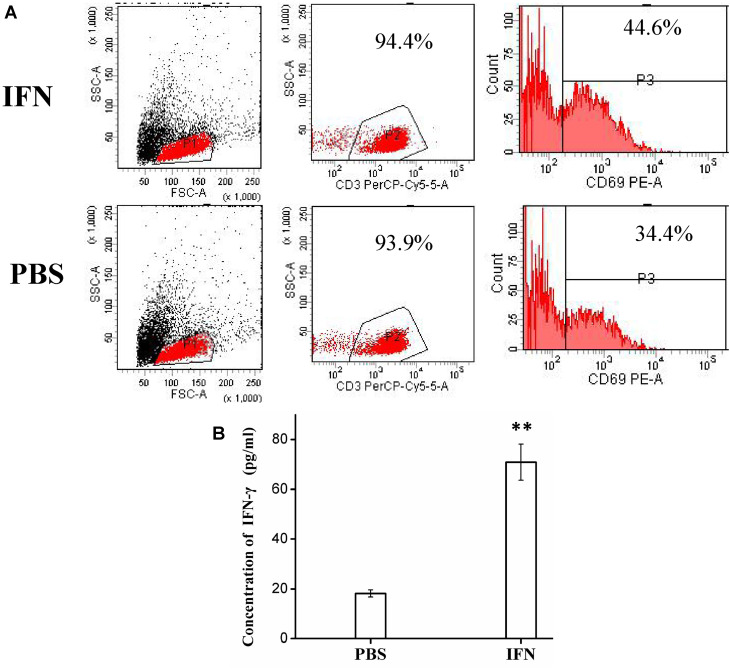
Figure 4.
(A) Flow cytometry detection of CD69+ T cells in PBS and IFN-α2b groups. (B) The IFN-γ expression of T cells when treated with IFN-α2b (1,000 IU/mL) or PBS solution for 12 h. Data are expressed as mean ± SD through three independent experiments (**P < 0.01).
Abbreviations: IFN, interferon; PBS, phosphate-buffered saline; FSC-A, forward scatter area; SSC-A, side scatter area; CD3, cluster of differentiation.

