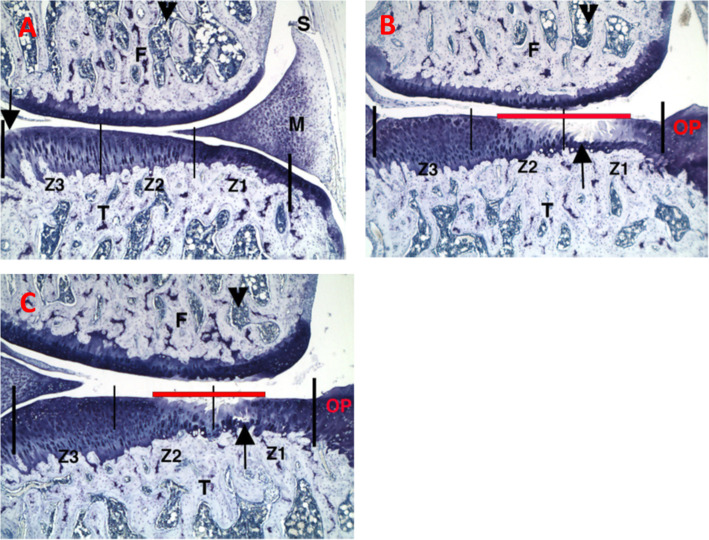
Fig. 1.
Representative histopathology photomicrographs stained with toluidine blue. a Sham control group, left knee, medial. b PBS injections at D7, D14, and D21, right knee, medial. c IA-BioHA injections (0.5 mg/rat) at D7, D14, D21, right knee, medial. Vertical bars delineate 2000 μm of tibial plateau and zones. F - femur; T - tibia; M - meniscus; S - synovium. Arrow identifies a small surface area of minor spontaneous cartilage degeneration in the area not protected by meniscus in zone 3. Arrowhead identifies bone marrow. Red horizontal line identifies extent of collagen degradation. Images acquired at 50x magnification

