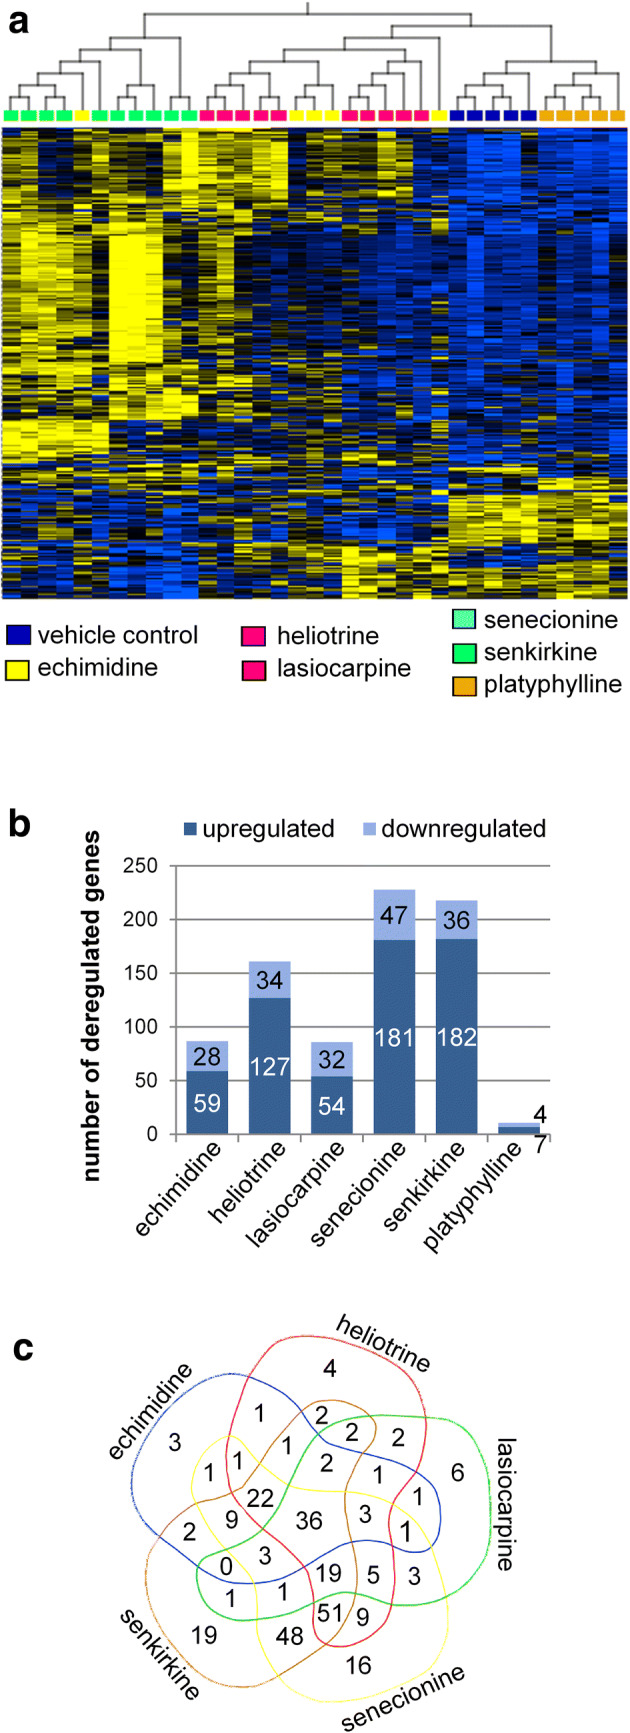
Fig. 2.

Comparison of dysregulated probe sets after oral treatment of male Fischer rats by gavage for 28 days with six different PA. Results for the high dose groups (3.3 mg/kg bw) are presented. a Clustering of gene expression changes in the liver following exposure to PA. Gene expression profiles were analyzed using Affymetrix microarrays. Rats were exposed to either 3.3 mg/kg bw echimidine (yellow), heliotrine (pink), lasiocarpine (red), senecionine (light blue), senkirkine (green), platyphylline (orange) or a solution of 0.15 M NaCl serving as vehicle control (dark blue). Each column represents a single animal. Each row shows a specific transcript. Microarray data were normalized, batch corrected and statistically analyzed using Qlucore Omics Explorer. A total of 284 probe sets were identified to be significantly differentially regulated (q < 0.05, ANOVA). Individual PA exposure effects and fold changes were determined by performing two-group comparison test versus the vehicle control. b The bar chart shows the average numbers of up- and downregulated probe sets for each treatment group. c The Venn diagram shows the average number of dysregulated probe sets for the different treatment groups (high dose groups with 3.3 mg/kg bw only) and their overlap. The Venn diagram was generated using https://bioinformatics.psb.ugent.be/webtools/Venn/
