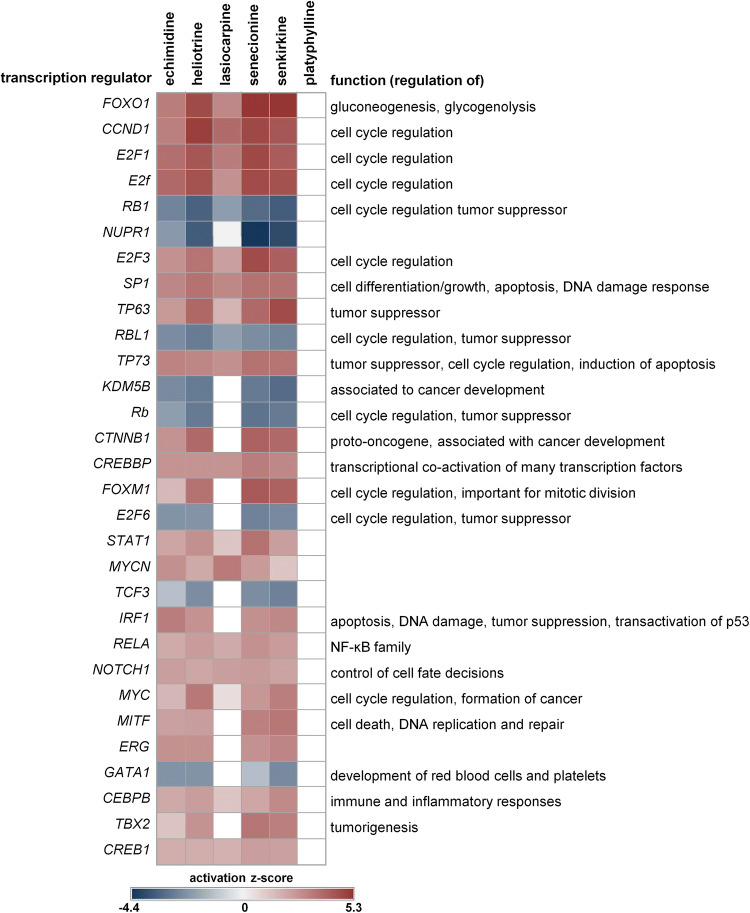
Fig. 6.
Transcription regulators predicted to be activated/inactivated by Ingenuity Pathway Analysis (IPA). A set of 284 significantly (q < 0.05) dysregulated rat liver transcripts was analyzed using IPA. Activation/inactivation of upstream regulators, filtered for transcription regulators, is displayed without using cutoffs. The heatmap shows the activation z-score for the respective regulator. The first 30 regulators with the highest positive or the lowest negative activation z-score are shown

