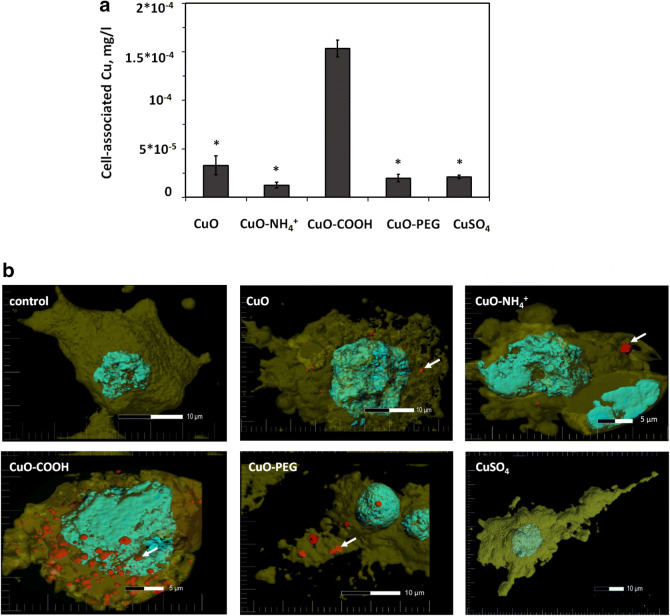
Fig. 4.
Interaction of Cu compounds with THP-1 cells. Concentration of copper associated with differentiated THP-1 cells after 24-h exposure to the equitoxic (EC20) concentrations of CuO NPs and CuSO4 (a). Asterisks show the statistically different values (p < 0.001). Representative confocal microscopy images of differentiated THP-1 macrophages exposed to equitoxic concentrations (24-h EC20) of Cu compounds for 24 h (b). Cell membranes were stained with Cell Mask Orange (yellow) and cell nucleus with DAPI (blue). Nanoparticles were visualized in red using reflective mode of the microscope. The arrows indicate the cellular localisation of the CuO NPs (color figure online)

