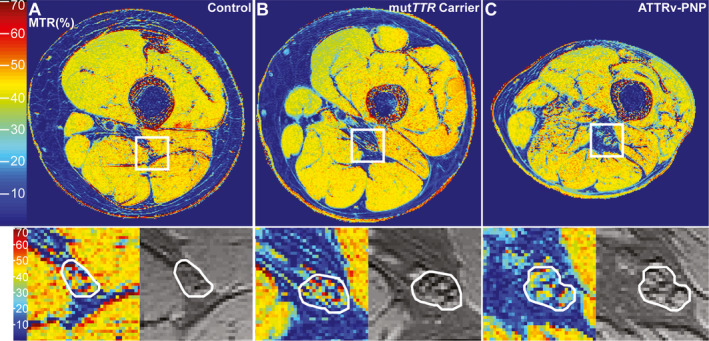
Figure 2.

Magnetization transfer ratio map. Representative MTR pseudo‐colorized (%) maps are shown for a healthy control (A), an asymptomatic mutTTR‐carrier (B), and a symptomatic ATTRv‐PNP patient (C). The white boxes in A–C are zoomed‐in and displayed below to show detailed views of the MTR (%) map (left) and the MTC sequence without the off‐resonance pulse (right) with the sciatic nerve encircled in white. Note the marked decrease of sciatic nerve MTR (%) in the asymptomatic mutTTR‐carrier (loss of red and yellow signals), and even further decrease in the symptomatic ATTRv‐PNP patient, compared to the control.
