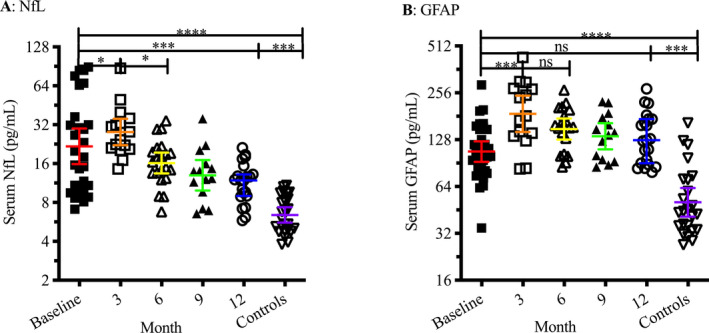
Figure 1.

Serum levels of both NfL (A) and GFAP (B) were elevated in patients with aggressive MS prior to IAHSCT compared with controls (P = 0.0001). Three months post‐IAHSCT, mean levels of both biomarkers transiently increased relative to pretreatment levels (NfL P = 0.029, GFAP P = 0.0004). While NfL levels durably went down to less than pretreatment levels by 12 months (P = 0.0005), levels of GFAP remained similar to pretreatment levels. Bars and error bars denote geometric mean and 95% confidence interval. ‘ns’ denotes a nonsignificant P value. *, **, ***, **** signify a P‐value ≤ 0.05, 0.01, 0.001, 0.0001 respectively.
