Figure 2.

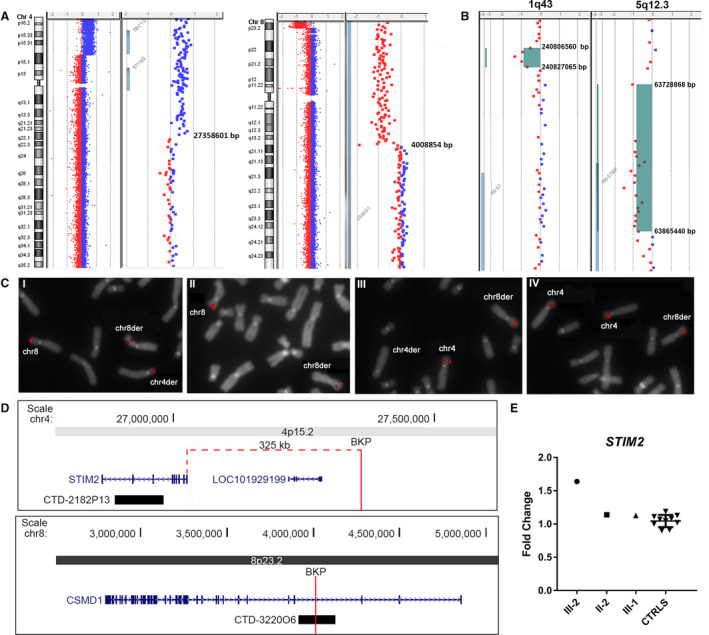
(A) Array‐CGH ratio profiles of proband III‐2. Chromosomes 4 and 8 ideograms showing the 27.3 Mb 4p terminal duplication, the 3.8 Mb 8p terminal deletion, and magnifications of the breakpoint regions showing gene content and genomic positions, according to the genome build CGRh37/hg19. (B) Array‐CGH profiles of two rare CNVs identified in III‐1 genome. 1q43 deletion, identified in III‐1 and her mother (II‐1), located about 112 kb from the 3’UTR of RGS7 gene, and 5q12.3 deletion, partially involving the RGS7BP gene, identified in III‐1, III‐2, and their father (II‐2). Gene content and genomic positions are shown, according to the genome build CGRh37/hg19. (C) FISH analysis of translocation breakpoints. FISH with BAC clone CTD‐322006 (I,II), which spans the translocation bkp at 8p23.3, yields hybridization signal on chromosome 8 and signals of diminished intensity on both derivative chromosomes in II‐2 (I), while in III‐2 (II) the probe produces a signal on chromosome 8 and a signal of diminished intensity on der(8). FISH with BAC clone CTD‐2182P13 (III,IV), partially covering the STIM2 gene sequence at 4p15.2, yields hybridization signals of equal intensity on chromosomes 4 and der(8) in II‐2 (III), but produces three signals of the same intensity on both chromosomes 4 and on der(8) in the proband III‐2 (IV). (D) Physical map of the genomic regions involved in the bkps. 4p15.2‐15.1 region showing the mapped genes, the position of the 4p translocation bkp and its distance from the 3’UTR of STIM2 gene, and the probe CTD‐2182P13used for FISH analysis. 8p23.2 region showing the position of the 8p translocation bkp disrupting the CSMD1 gene at IVS3 and the probe CTD‐322006 used for FISH analysis. (E) STIM2 gene expression analysis. Relative expression of STIM2 blood mRNA in the proband (III‐2), his father (II‐2), and his sister (III‐1), compared to 10 healthy controls. STIM2 showed a significant overexpression in III‐2, while a normal expression level was found in II‐2 and III‐1 compared to controls. Data were normalized against TBP as housekeeping gene; similar results were obtained using GAPDH as normalizer (data not shown).
[Corrections added on 21 May 2020 after first publication: Figure 2 has been corrected.]
