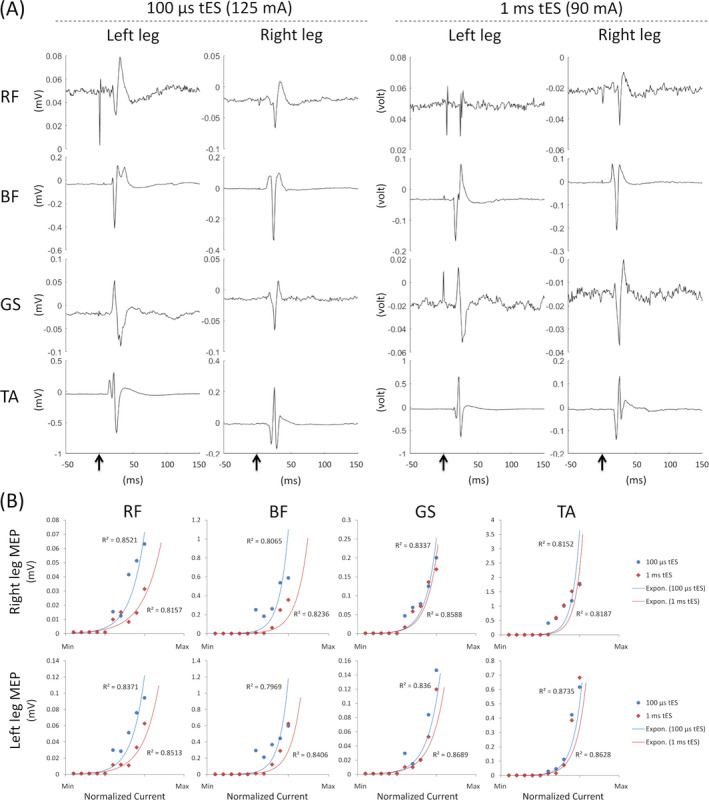
Figure 2.

Transcutaneous electrical stimulation (tES) at T11 and L1 spinal level induced motor evoked potential (MEP) in different lower‐limb muscles every 2 sec. (A) MEP induced with 100 µsec at 125 mA and with 1 msec tES at 90 mA stimulation intensities. (B) Motor recruitments were calculated from peak‐to‐peak amplitude of MEP signals at different stimulation intensities for both stimulation configurations (100 µsec and 1 msec tES settings). Each R 2 value indicates the exponential fit of motor recruitments. RF, rectus femoris, BF, biceps femoris; GS, gastrocnemius; TA, tibialis anterior.
