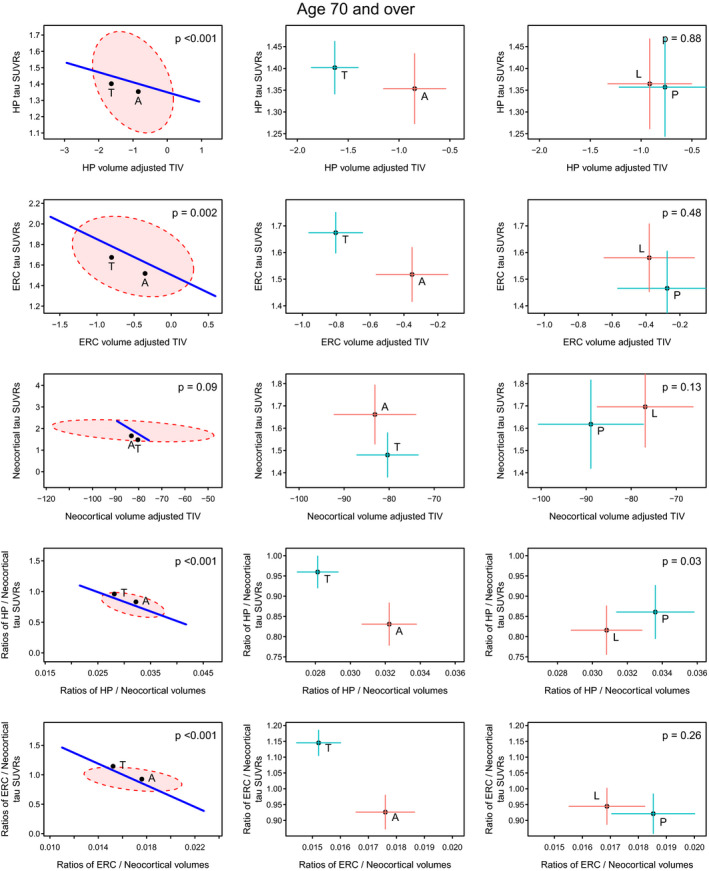
Figure 3.

Volume and flortaucipir findings across AD phenotypes within the 70+ genarian. Significance scaling hypothesis error plots are shown in the left column. The ellipse represents within‐group variation (how much the individuals vary from the group mean), with the line representing between‐group (i.e., Ty‐AD (T) vs. Aty‐AD (A)) variation. Significance scaling was applied so that if the line extends outside the ellipse the multivariate test is significant at P < 0.05 (P values shown in each plot). The black dots represent group means. The plots in the middle (atypical AD vs. typical AD) and right (PCA (P) vs. LPA (L)) columns show estimated group means with 95% confidence interval error bars (red vertical for flortaucipir and blue horizontal for volume). If error bars do not cross then group means can be considered significantly different. The greater the separation of the crosses the more significant the difference which applies to vertical and horizontal separations for the variables labeled on each axis.
