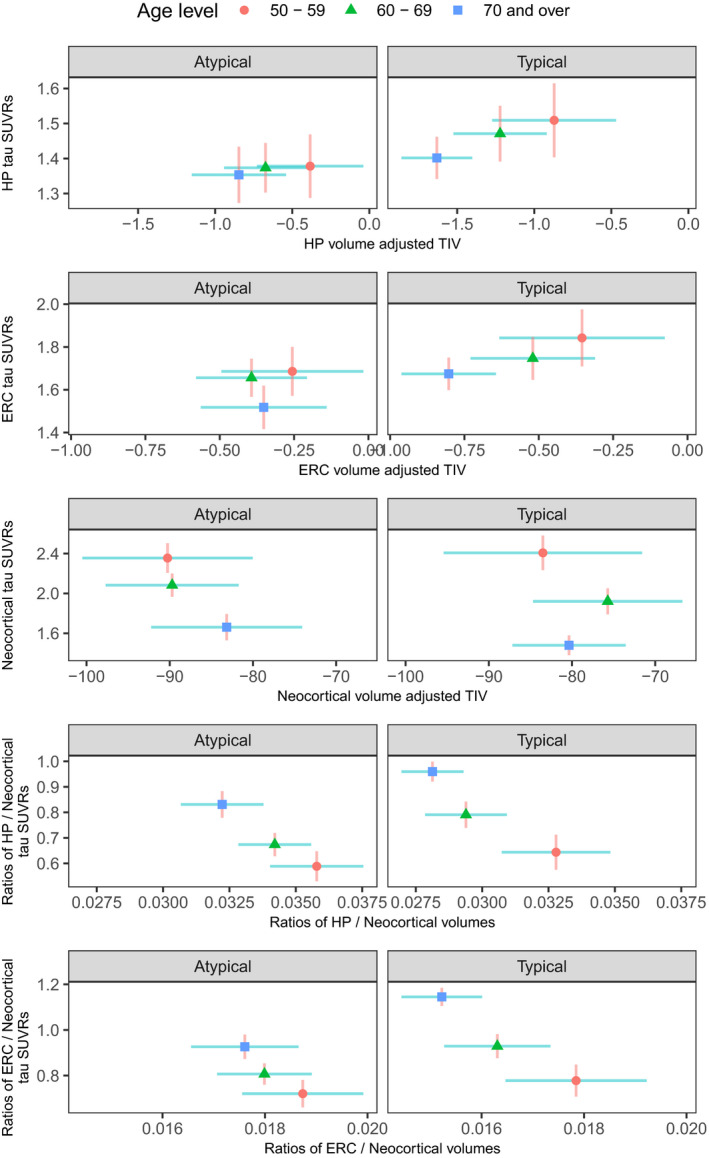
Figure 4.

Volume and flortaucipir findings across genarians for Aty‐AD and Ty‐AD. Plots show estimated group means for each genarian with 95% confidence interval error bars (red vertical for flortaucipir and blue horizontal for volume). If error bars do not cross then group means can be considered significantly different. The greater the separation of the crosses the more significant the difference which applies to the vertical and horizontal separations for the variables labeled on each axis.
