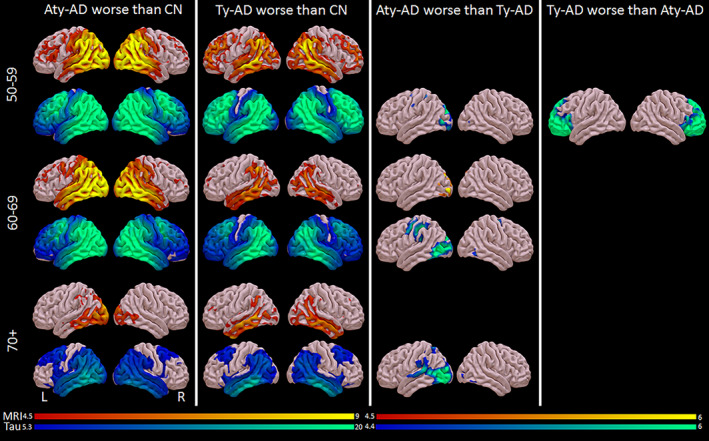
Figure 5.

Voxel‐level cortical volume (red/yellow) and flortaucipir (blue/green) findings across phenotypes and genarians. Results are shown on three‐dimensional brain renderings created using the Surf ice software program (http://www.nitrc.org). Grey matter volume results are shown corrected for multiple comparisons using FWE at P < 0.05. Flortaucipir results comparing AD groups with controls (first two columns) are shown corrected for multiple comparisons using FWE correction at P < 0.0001 because results were so extensive, and comparing the two AD groups (third column) are shown corrected for multiple comparisons using FWE at P < 0.05.
