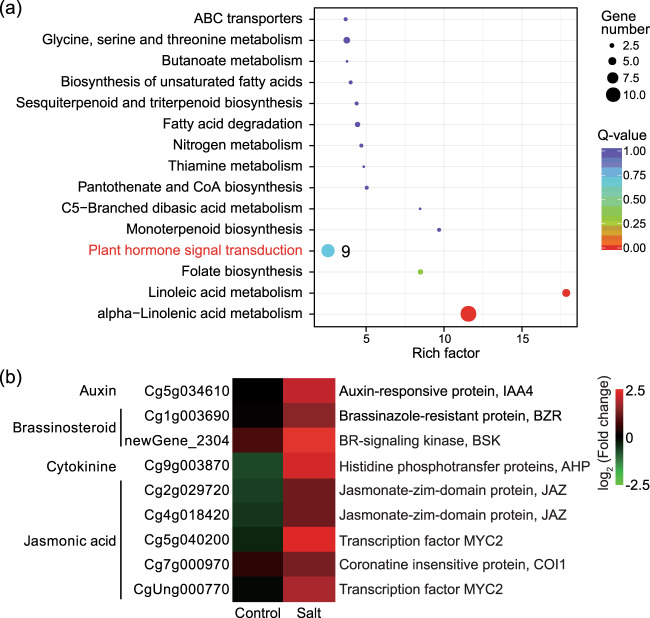
Fig. 4. KEGG enrichment analysis of the DEGs in leaves and expression of plant hormone-related genes.
a The 15 most significantly enriched KEGG pathways of upregulated genes in tetraploids relative to those in diploids under salt stress (4S vs. 2S). The dot color and size indicate the Q-value and gene number, respectively, as shown on the right. The numerals beside the dot indicate the number of DEGs enriched in the pathway. b Heatmap of gene expression for nine DEGs enriched in the ‘plant hormone signal transduction’ pathway. Heatmap color indicates fold change of expression in tetraploid leaves compared with that in diploid leaves under control and salt treatments

