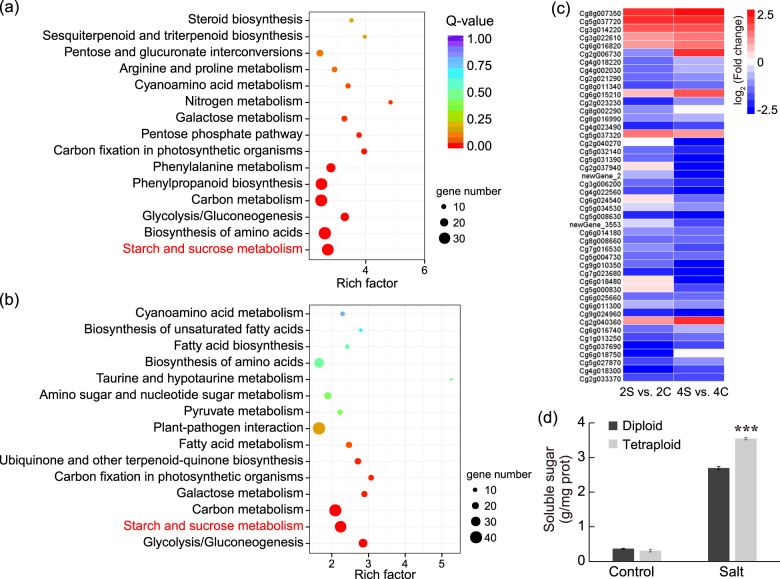
Fig. 5. KEGG enrichment analysis of DEGs and soluble sugar content in diploid and tetraploid roots.
a, b The 15 most significantly enriched KEGG pathways for DEGs in response to salt stress in diploids (a) and tetraploids (b). c Expression pattern of DEGs from the ‘starch and sucrose metabolism’ pathway in diploid and tetraploid roots under salt stress. Heatmap colors indicate fold change in expression, and red and blue indicate from high and low expression, respectively, as shown on the right. d Soluble sugar content in diploid and tetraploid roots under control and salt treatment. Error bars indicate SE (n = 3). Asterisks (***P < 0.001) indicate significant differences between diploids and tetraploids

