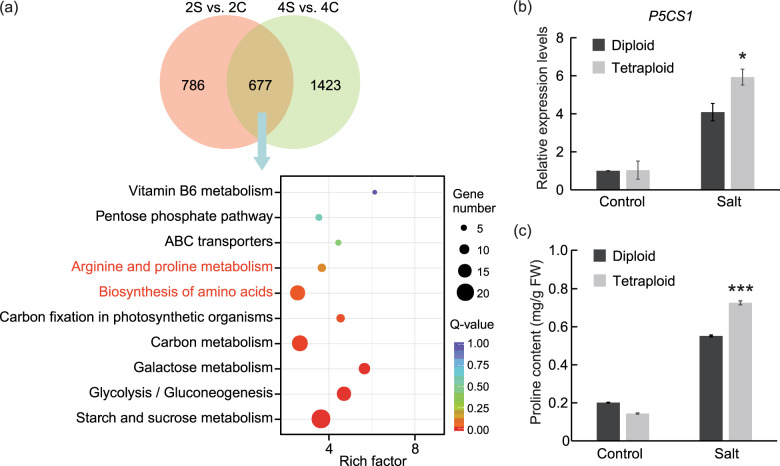
Fig. 6. Expression patterns of proline-related DEGs and measurement of proline content in diploid and tetraploid roots under control and salt treatment.
a Venn diagrams of DEGs in response to salt stress in diploids (2S vs. 2C) and tetraploids (4S vs. 4C) and the 10 most significantly enriched KEGG pathways based on the 677 DEGs. b, c Relative expression levels of the P5CS1 gene (b) and proline content (c) in diploids and tetraploids under control and salt treatments. Error bars indicate SE (n = 3). Asterisks (*P < 0.05; ***P < 0.001) indicate significant differences between the diploids and tetraploids

