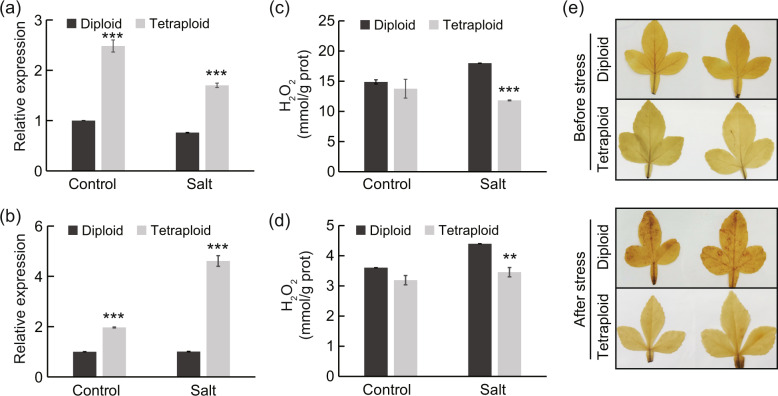
Fig. 7. Antioxidant gene expression and ROS accumulation in diploids and tetraploids under control and salt treatment.
a, b Relative gene expression levels of POD (Cg2g045100) in leaves (a) and APX (Cg3g014650) in roots (b) under control and salt treatment. c, d H2O2 content in the leaves (c) and roots (d) of diploid and tetraploid plants under control and salt treatment. Error bars indicate SE (n = 3). Asterisks indicate significant differences between the diploids and tetraploids (**P < 0.01; ***P < 0.001). e In situ visualization of H2O2 accumulation by DAB staining in diploid and tetraploid leaves before and after salt stress

