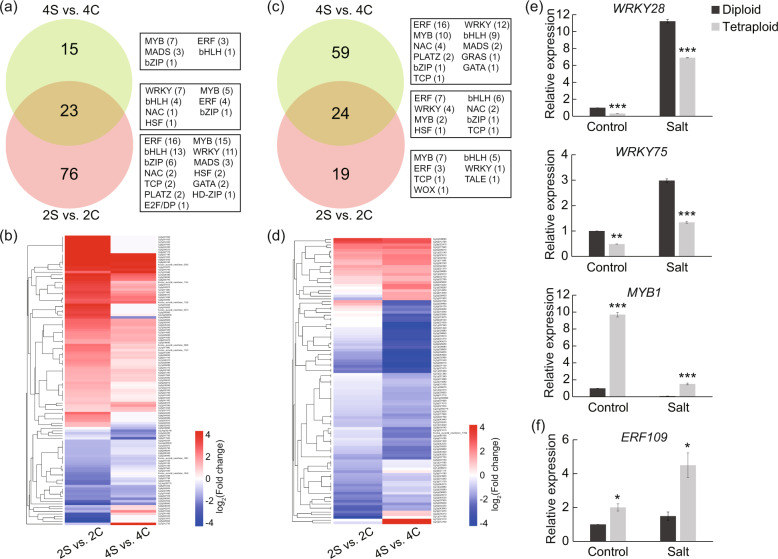
Fig. 8. Analysis of differentially expressed TFs in diploids and tetraploids.
a–d Venn diagrams and corresponding heatmaps for salt-induced TFs in the leaves (a, b) and roots (c, d) of diploids and tetraploids. The numerals inside the Venn circles indicate the number of differentially expressed TF genes in each comparison. The subfamilies are shown on the right, and the number of TFs in each subfamily is shown in parentheses. e, f Relative expression levels of three TF genes in leaves (e) and one TF gene in roots (f), as revealed by qPCR. Error bars indicate SE (n = 3). Asterisks indicate significant differences between the diploids and tetraploids (*P < 0.05; **P < 0.01; ***P < 0.001)

