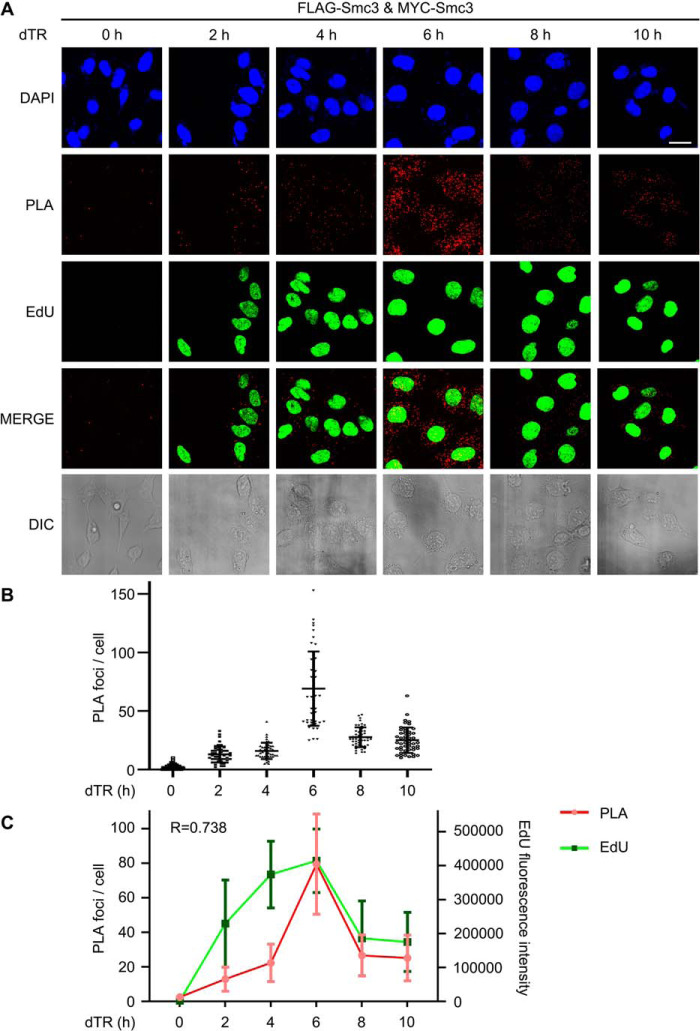
Figure 3.
DNA replication-coupled Smc3-Smc3 interaction in human cells. A, in situ PLA of Smc3-Smc3 in human cells. 293T cells expressing 5FLAG-Smc3 and 13MYC-Smc3 were cultured and synchronized in early S phase by double-thymidine arrest before release (dTR) into the fresh medium containing EdU. Cells were collected at the indicated time points. PLA was performed by proximity probes against FLAG and MYC. EdU was detected via click chemistry. Bar, 20 μm. B, scatter plot of PLA foci per cell throughout the cell cycle. The number of PLA spots within a cell was quantified. At least 50 cells were measured for each time point. The mean ± S.D. values are shown. C, correlation analysis of PLA spots (red) and EdU intensity (green) per cell. The intensity of EdU was measured by ImageJ. The maximal values for in situ PLA and EdU were normalized to allow a comparison between the different assays. The mean ± S.D. (error bars) values and Pearson product-moment correlation coefficient (r) are shown (n = 50 cells).

