Figure 3.
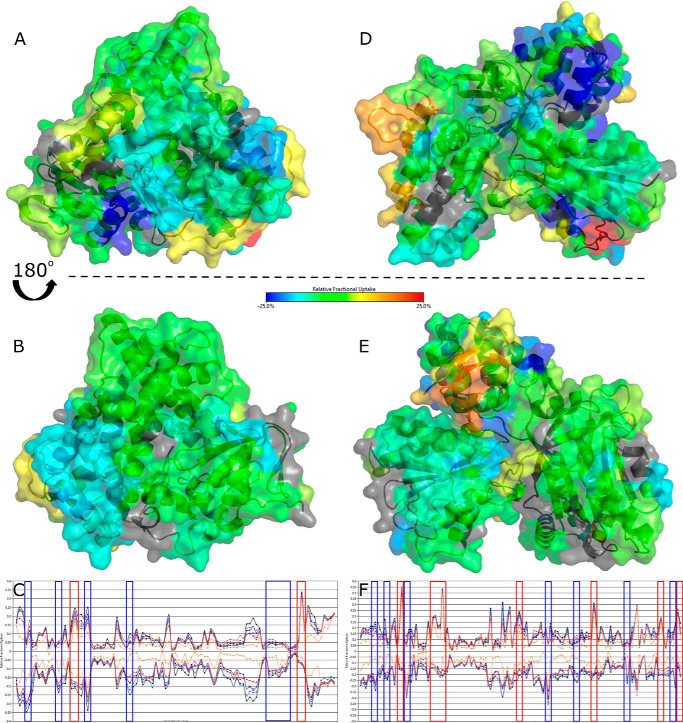
HDX-MS of the surface of the P450 BM3 heme and CPR domains compared with the full-length dimeric protein. Comparisons of the heme and CPR domains to the full-length dimeric P450 BM3 show areas of increased shielding (cyan and dark blue) and solvent accessibility because of deshielding (orange and red). Residues with no coverage are displayed in gray. The crystal structures used are 1BU7 (heme domain) and 1BVY/4DQK (FMN-binding domain and FAD/NADPH-binding domain, respectively) aligned to the rat CPR 1AMO structure as a CPR model. Residues with significant deuterium uptake changes are shown in Fig. S2. A and B, comparing the heme domain to the heme domain of the full-length dimeric P450 BM3 protein shows some areas of change. The area with the greatest shielding (dark blue) when the reductase domain is present is from residues 22–30 on the distal face of the protein, seen clearly in A. The area of greatest solvent accessibility centers around glutamic acid 424 (red). Coverage maps for the HDX-MS heme domain data are shown in Fig. S3A. D and E, the CPR domain exhibits a highly dynamic structure, as shown by large changes in deuterium uptake. Many areas within the full-length P450 BM3 protein are deshielded, leading to increasing deuterium exchange (orange-red). In particular, a portion of the hinge domain of the FAD-binding domain (residues 721–729 in yellow and residues 732–748 in orange) and the corresponding shielded areas (residues 709–720, 766–767, and 773–781 in dark blue) suggest significant protein movement. Coverage maps for the HDX-MS CPR domain data are shown in Fig. S3B. C–F, butterfly plots show the difference in relative deuterium uptake for each peptide fragment for the heme and CPR domains compared with the full-length protein, respectively. The upper states in both plots correspond to the full-length protein and the lower states to the heme (C) and CPR (F) domains. Multiple time points for deuterium uptake are observed for each peptide: 1 min (orange), 10 min (red), 30 min (gray), 60 min (light blue), 180 min (dark blue), and 480 min (black). Vertical lines enclose regions of greatest change, as exhibited in A, B, D, and E, with blue corresponding to shielding and red corresponding to deshielding for the full-length P450 BM3 dimeric protein compared with its domains.

