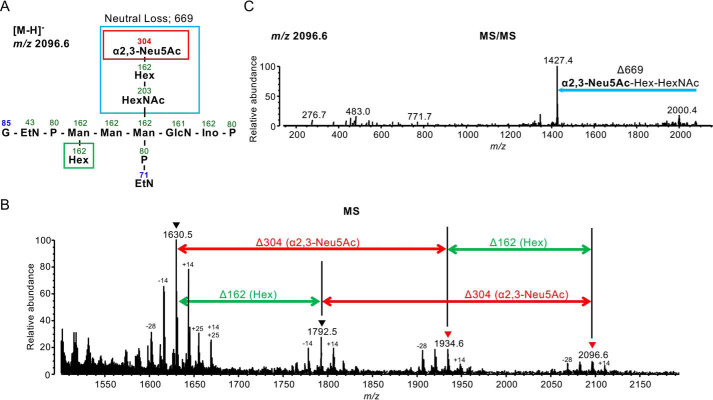
Figure 4.
Linkage analysis of Sia in GPI anchors using the SALSA method. A, structure of a peptide with the GPI glycan displayed in B and C. Numbers indicate m/z values. Boxes show the neutral loss after MS/MS analysis. B, MS spectra of peptides containing the GPI glycan shown in A. A 304-Da difference indicates the presence of α2,3-linked Neu5Ac. C, the MS/MS spectrum of a C-terminal peptide with GPI containing Hex and HexNAc-Hex-Neu5Ac. A 669-Da loss indicates loss of α2,3-linked Neu5Ac, Hex (Gal), and HexNAc (GalNAc).

