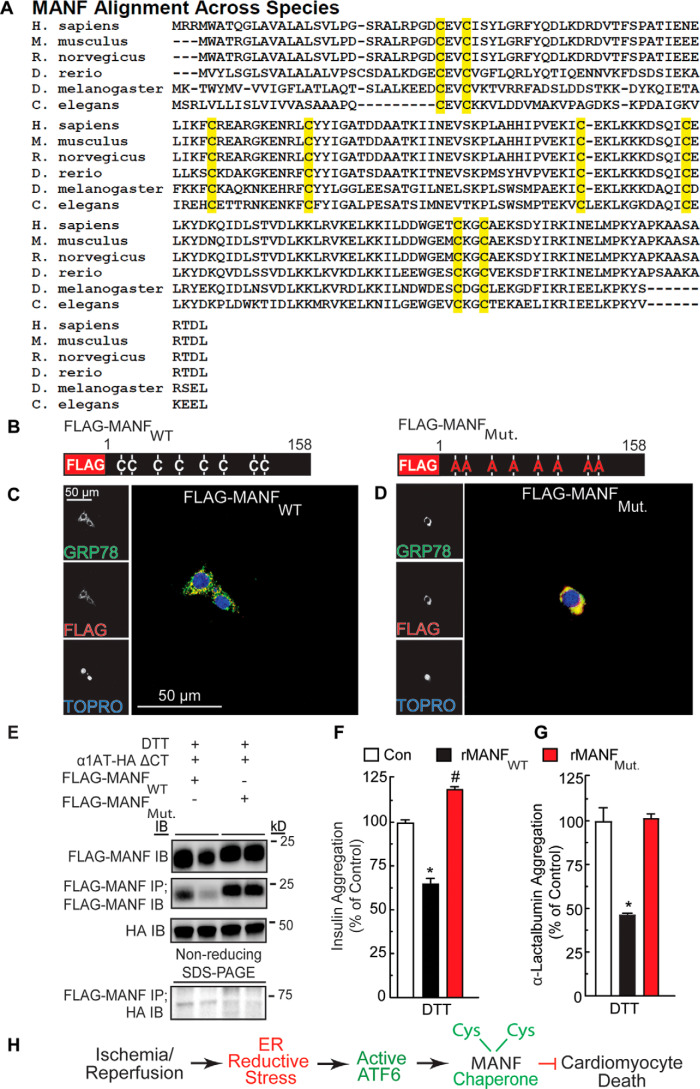
Figure 6.
Effect of mutation of the conserved cysteine residues in MANF on MANF redox status and chaperone function. A, alignment of MANF sequences from different species. Highlighted in yellow are the positions of cysteine residues, the positions of which are conserved across the species shown. B, diagram of FLAG-MANFWT and FLAG-MANFMut. constructs indicating cysteine-to-alanine mutations. C and D, immunocytofluorescence of FLAG-MANF. NRVMs were transfected with siManf targeted to the 3′-UTR of the Manf transcript, followed by infection with AdV-FLAG-MANFWT (C) or AdV-FLAG-MANFMut. (D) and then treated with tunicamycin to induce GRP78 expression. NRVMs were then examined by immunocytofluorescence for GRP78 (green) and FLAG-MANF (red). Nuclei are indicated by TOPRO staining (blue). E, duplicate HeLa cell cultures were co-transfected with plasmid constructs encoding FLAG-MANFWT or FLAG-MANFMut. and α1AT-HA ΔCT and treated with DTT. The cell extracts were subjected to reducing SDS-PAGE followed by immunoblotting for α1AT-HA ΔCT (∼45 kDa) or FLAG-MANF (∼20 kDa). The cell extracts were also subjected to FLAG IP followed by nonreducing SDS-PAGE to maintain possible disulfide bonds between MANF and other proteins and then IB HA (bottom). (Note the FLAG-MANF/α1AT-HA ΔCT complex shown at ∼65 kDa). F, effect of recombinant MANFWT (23.4 μm) or MANFMut. (23.4 μm) on aggregation of insulin (113 μm). G, effect of recombinant MANFWT (21 μm) or MANFMut. (21 μm) on aggregation of α-lactalbumin (14 μm). * and #, statistically significant difference from all other groups by one-way ANOVA, p ≤ 0.05, followed by Newman–Keuls post hoc analysis. H, diagram depicting the function and mechanism of action of endogenous MANF in the heart resulting from this study. Error bars, S.E.

