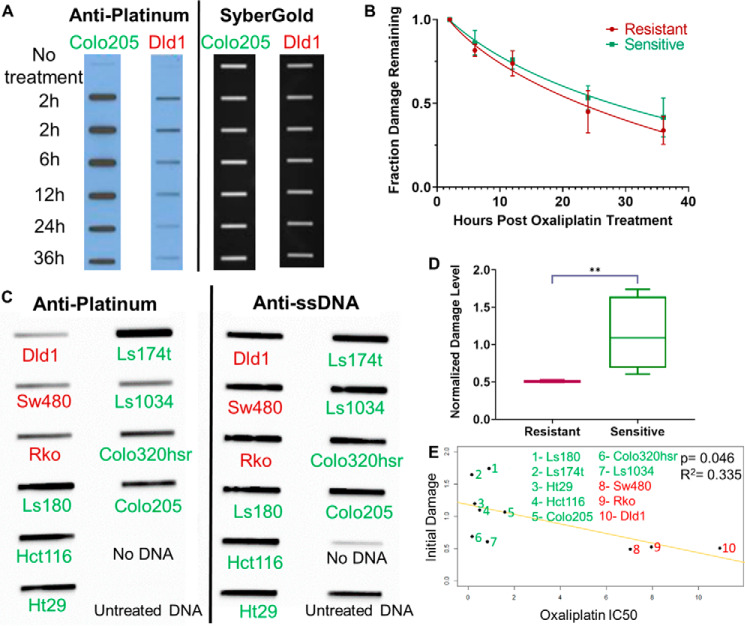
Figure 2.
Oxaliplatin repair and damage formation. A, repair kinetics in oxaliplatin-sensitive and -resistant cell lines. Representative slot blot shows loss of damage from the genome with time following 2 h of treatment of a sensitive cell line (Colo205) and a resistant cell line (Dld1) with 200 μm oxaliplatin. Probing with anti-platinum–DNA adduct antibody (left) reveals the genomic DNA damage levels, and subsequent SyberGold staining of the same blot (right) shows the total amount of DNA blotted onto the membrane through each slot. B, average values for repair in the three sensitive and two resistant cell lines assayed are plotted and show no significant difference in repair rate. Two technical replicates of two biological replicates were done for each cell line. C, representative slot blot showing damage level following 2 h exposure of the oxaliplatin-resistant (red) and -sensitive (green) cell lines to oxaliplatin. Probing with anti-ssDNA reveals the total amount of DNA on the membrane. D, a plot of average initial damage levels for three resistant cell lines (red) and seven sensitive cell lines (green) shows a significant difference (p = 0.008, Welch's t test) between the two groups, indicating that a lower initial damage level correlates with resistance. E, a trend line fitting the IC50 values (x axis) and normalized initial damage levels (y axis) is plotted. A significant (Pearson's correlation, p = 0.046), inverse correlation again indicates that lower initial damage levels correlate with resistance.

