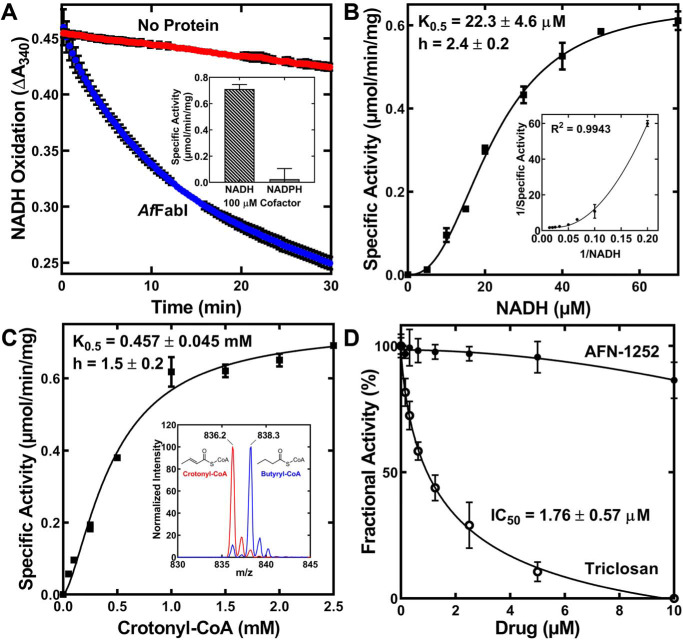
Figure 4.
AfFabI displays prototypical FabI kinetics. A, the rate of 200 μm NADH oxidation in 1.25 mm crotonyl-CoA, 20 mm Tris-HCl, pH 8.0, as measured by the change in absorbance at 340 nm with (blue) or without (red) 100 nm AfFabI. The slope of the linear phase of the progress curve was converted to specific activity using the NADH extinction coefficient of 6220 m−1 cm−1. Inset, NADPH did not support the reaction. B, specific activities were calculated as a function of NADH concentration. The behavior of AfFabI with NADH is best described by the Hill equation (fitted line shown on graph). C, specific activities were calculated as a function of crotonyl-CoA concentration. The behavior of AfFabI with crotonyl-CoA is best described by the Hill equation (fitted line shown on graph). Inset, mass spectrum analysis of the reaction mixture shows reduction of crotonyl-CoA (m/z = 836.2) to butyryl-CoA (m/z = 838.3) either with (blue) or without (red) AfFabI. D, fractional activity of AfFabI versus increasing concentrations of AFN-1252 or triclosan. Data points were fit to the inhibitor versus response. Variable slope nonlinear regression equation using GraphPad Prism 8.2.1 software and the fitted lines are shown on the graph. AfFabI spectrophotometric assays were performed in triplicate as described under “Experimental procedures.” Mean ± S.E. (n = 3).

