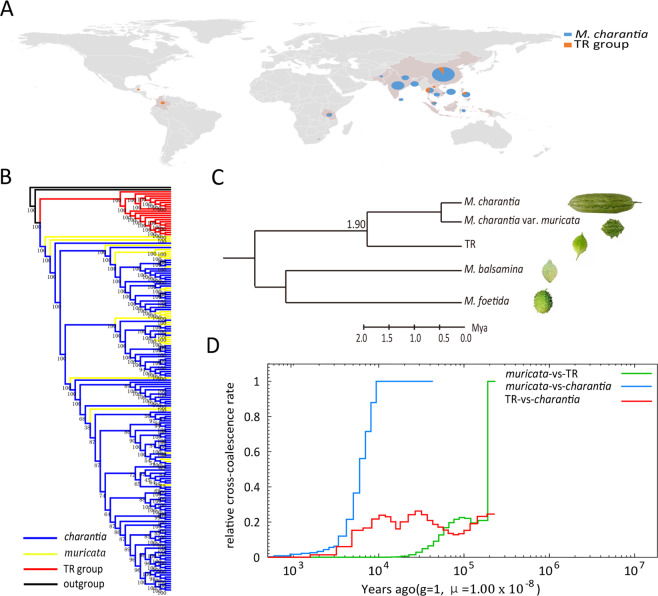
Fig. 2. Evolution of bitter gourd.
a The geographic distribution of the 187 bitter gourd samples included in the population analysis. b Neighbor-joining tree for 189 Momordica samples with different taxa represented by different colors: TR (red), muricata (yellow), charantia (blue), and M. balsamina and M. foetida (black) as outgroups. c Phylogeny of Momordica with the inferred divergence time between TR and M. charantia (Supplementary Fig. S10). d MSMC plots of inferred genetic divergence times (colored lines) among TR, muricata, and charantia. The split between the two genomes is defined as the time when the cross-coalescence rate drops to 50%

