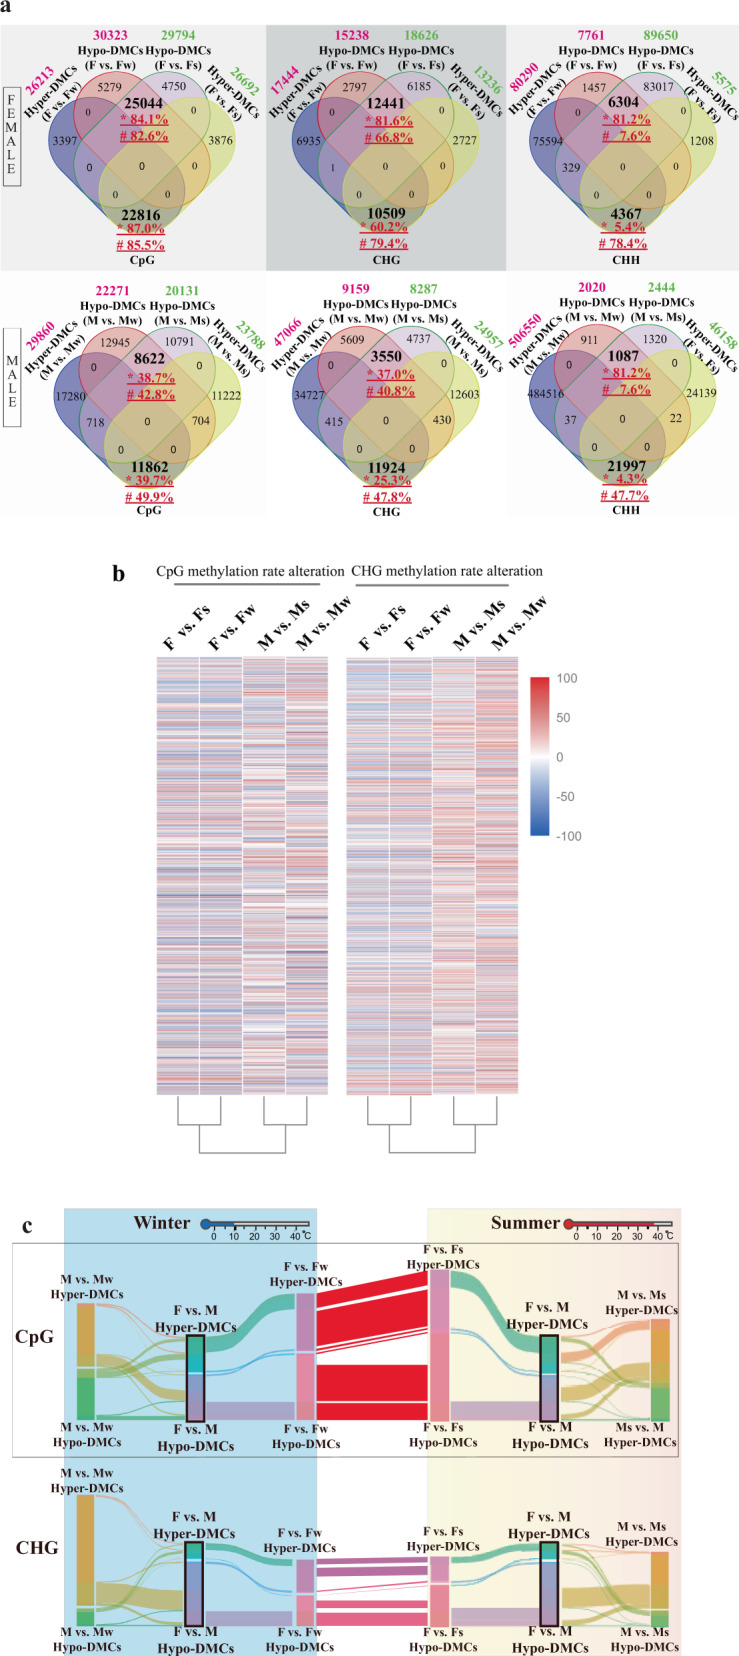
Fig. 2. Methylation pattern changes in female and male flowers under stress.

a Venn diagram of hyper-DMCs and hypo-DMCs in female and male flowers. The number in green shows the amount of hyper-DMCs or hypo-DMCs occurring in the flowers grown in summer; the number in magenta indicates the amount of hyper-DMCs or hypo-DMCs appearing in flowers grown in winter. Symbols * followed by the percentages represent the proportion of common hyper-DMCs or hypo-DMCs when comparing these common DMCs with hyper-DMCs or hypo-DMCs occurring in summer flowers; similarly, for #, the percentages were the proportion of common hyper-DMCs or hypo-DMCs when comparing them to hyper-DMCs or hypo-DMCs of winter flowers. b The methylation changes of female- and male-flowers DMCs in summer and winter. c Sankey diagram showing DMC changes in female and male flowers under different stress conditions. The DMCs with the same genomic locations were linked by streams across vertical blocks that represented hyper- or hypo-DMC sets in corresponding comparisons. The height of each vertical block represented the total number of relevant DMCs. The vertical height of stream line was inferred to the number of identical DMCs between the neighboring block. As seen in the figure, some blocks of DMC sets (F vs. M) could be clustered and linked to other sets, which means that these parts of DMCs occurring in female−male comparison have been reprogrammed in other types of flowers, that is, the methylation pattern of these cytosine loci was reset
