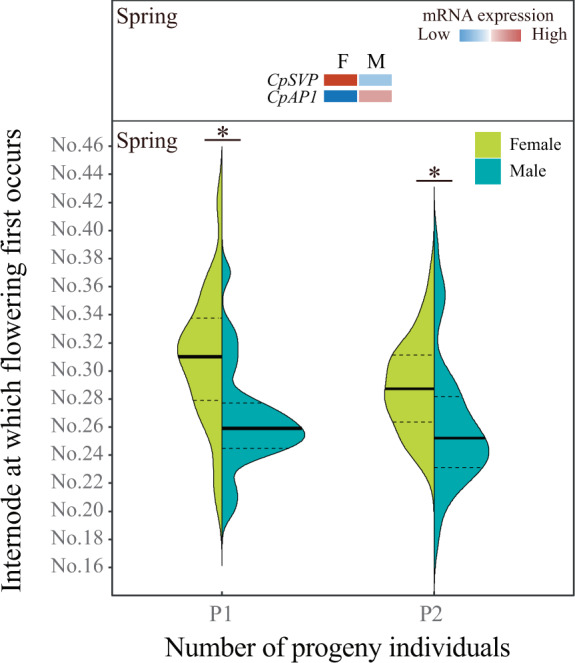
Fig. 6. Field observation of flowering time in male and female progeny.

The violin plot showed the continuous numeric data distribution of the internode position at which first inflorescence occurred in female and male plants. The inner part of the violin plot shows the mean (heavy line) and the interquartile range (dotted line). P1: the first batch of seedlings germinated on December 1, 2016; P2: the second batch of seedlings germinated on December 15, 2016. Asterisk designated a significant difference (t test, P < 0.05) of inflorescence initiation between male and female progeny
