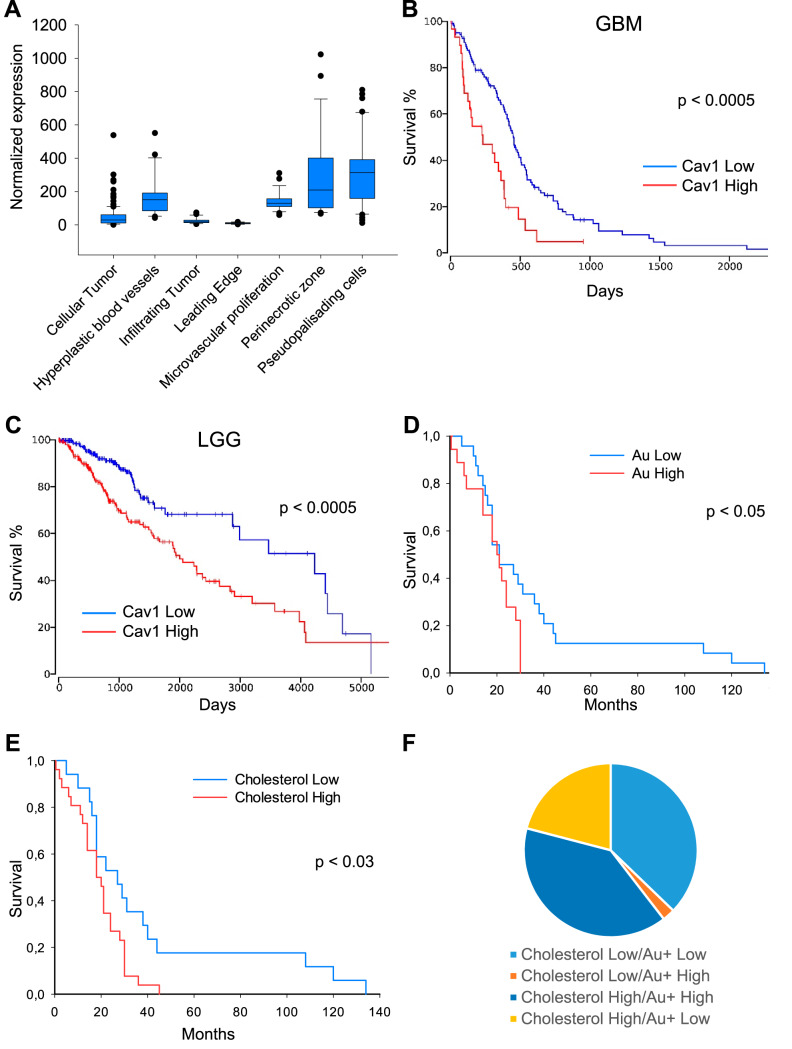
Fig. 4.
Association between Caveolin-1 gene expression and characteristics of glioma tumors. A, Analysis of RNA sequencing data from IVY database demonstrating expression of Cav1 gene by GBM cells located in morphologically different regions of the tumors. B, Kaplan-Meier curve showing the overall survival of glioblastoma patients (n = 152) subdivided based on Caveolin-1 expression levels. Data were obtained from TCGA database. C, Same as B for low grade glioma patients (n = 510). D, Kaplan-Meier curve showing the overall survival of glioma patients (n = 45) subdivided into two groups based on the intensity of immunogold staining detected by TOF-SIMS. E, Same as D for glioma samples subdivided by cholesterol content detected by TOF-SIMS. F, Diagram demonstrating the amount of glioma samples with low and high cholesterol and Caveolin-1 content.

