Fig. 5.
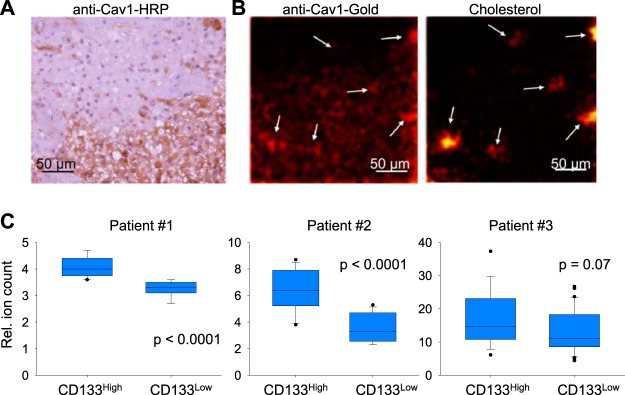
Distribution of Caveolin-1 and cholesterol in GBM cells and tissues. A, Section of GBM tumor stained with primary antibodies against Caveolin-1 and secondary antibodies conjugated with horseradish peroxidase. B, Representative pseudocolored images demonstrating intensity of signal corresponding to cholesterol fragment (m/z = 147.12) and Au+ which were detected by TOF-SIMS in GBM section stained with antibodies against Caveolin-1 conjugated with gold nanoparticles. C, Signal of cholesterol fragment (m/z = 147.12) detected by TOF-SIMS in GBM neurosphere primary cultures obtained from three different patients and divided into CD133high and CD133low populations by staining with anti-CD133 antibodies conjugated with APC and subsequent FACS sorting.

