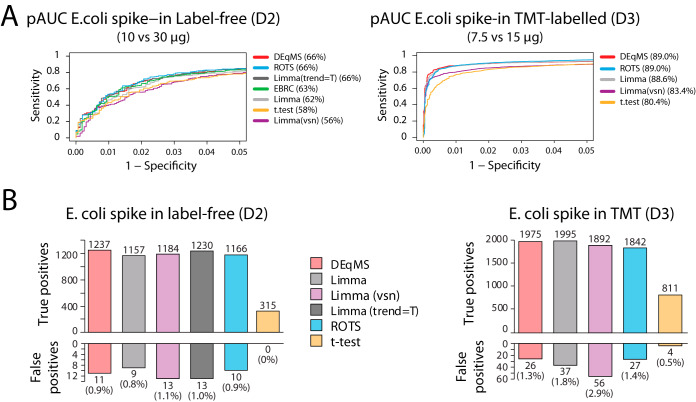
Fig. 2.
Performance of DEqMS in spike-in MS proteomics data. A, ROC curves for different methods used to analyze label-free (left) and TMT-labeled (right) E. coli spike-in data. Absolute value of t-statistics reported by different methods was used to compute area under curve. Indicated in the parentheses for each method is the partial area under curve (pAUC, in the range specificity>95%) expressed as a percentage relative to the maximum value in the specified range. Limma(vsn) shows the result of applying Limma on intensities normalized by variance stabilization method. B, True positive and false positive (adjusted p value<0.01) findings in label-free (left) and TMT-labeled (right) spike-in data using different analysis methods. Limma (trend = T) was not evaluated for TMT data because all other methods use protein log ratio matrix as input, and Limma (trend = T) requires estimation of protein intensity from PSM intensity, which is not a common practice to analyze TMT data. Associated data and results are available in supplemental Tables S1–S3.

