Fig. 3.
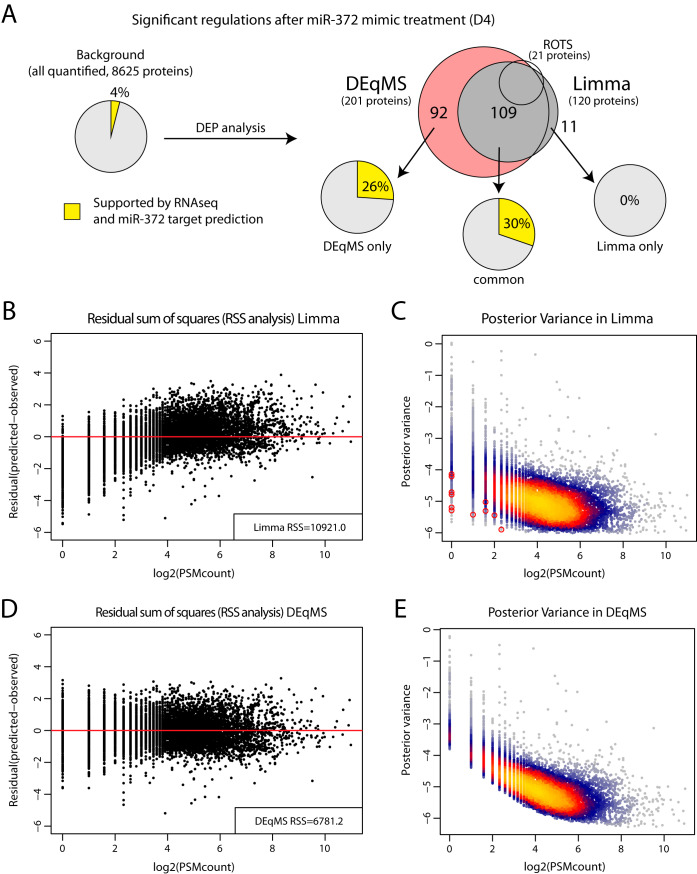
Application of DEqMS in real world MS proteomics data. a. Overlap of significant findings in the analysis of miR-372 mimic treated U1810 cells using different methods. Indicated in the figure is the number of significantly regulated proteins (DEPs) as identified by DEqMS only, Limma only, by both methods or by ROTS. Also indicated in piecharts for different sets of DEPs is the support of the corresponding mRNAs as miRNA targets. Support (yellow) indicates proportion of proteins where the corresponding mRNA was downregulated as evaluated by RNA-seq analysis, as well as predicted as being miR-372 targets by microRNA target prediction algorithms. For comparison, the overall background support in the entire data set is also shown. B–E, Comparison of variance estimate between Limma and DEqMS showing residual sum of squares (RSS) analysis of the prior variance estimate (B, C) and the relation between posterior variance and PSM count (D, E). The red circles in (D) indicate the 11 significant genes uniquely found by Limma, whereas these were rejected in DEqMS after adjusting the variance based on the number of quantified PSMs.

