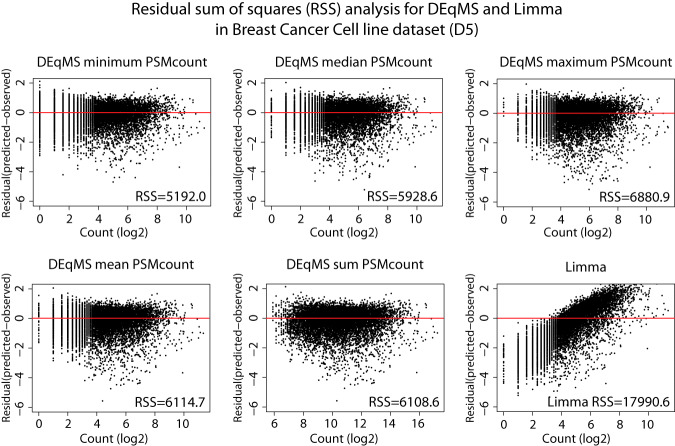
Fig. 4.
Comparison of different PSM count metrics for data sets based on more than one TMT-experiment. For data sets based on more than one TMT-experiment, proteins are usually quantified with a different number of PSMs in different TMT experiments. In DEqMS these numbers has to be unified to a single PSM count metric for each protein. The plots show the residual sum of squares (RSS) analysis for different PSMcount metrics. Shown in the figure are RSS plots for breast cancer cell line data set (D5) for DEqMS using minimum, median, maximum, mean and sum PSMcount and for Limma.

