Fig. 6.

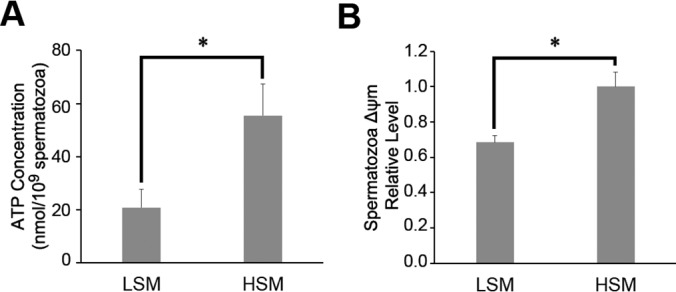
ATP concentration (A) and mitochondrial membrane potentials levels (B) in low and high motility sperm samples. ΔΨm, Mitochondrial membrane potentials; LSM, low sperm motility; HSM, high sperm motility; * p < 0.05.

ATP concentration (A) and mitochondrial membrane potentials levels (B) in low and high motility sperm samples. ΔΨm, Mitochondrial membrane potentials; LSM, low sperm motility; HSM, high sperm motility; * p < 0.05.