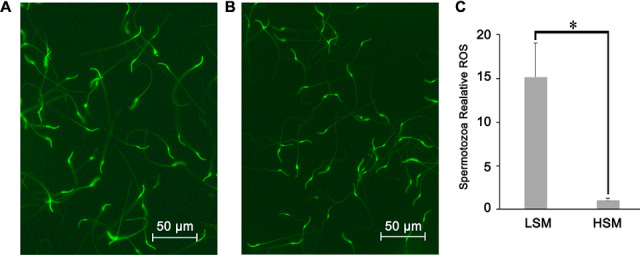
Fig. 9.

Evaluation of spermatozoa reactive oxygen species (ROS) level in low and high sperm motility samples. A, Fluorescent microscopic images of LSM sample; B, Fluorescent microscopic images of HSM sample; C, Bars represent spermatozoa ROS normalized by mean fluorescence intensity of the HSM samples, values are specified as mean ± S.E.; LSM, low sperm motility; HSM, high sperm motility; * p < 0.05.
