Fig. 1.
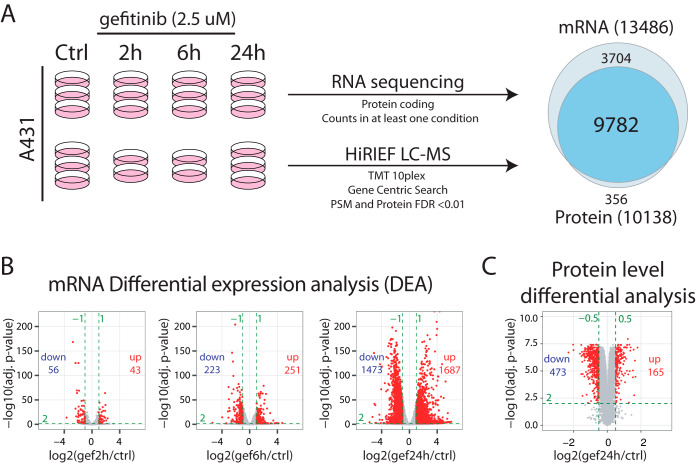
EGFR-TKI molecular response profiling. A, A431 cells in replicate cultures were untreated or treated with 2.5 μm gefitinib for 2/6/24 h. Transcriptomics profiling was performed using RNA sequencing of triplicate samples for each condition. Proteomics profiling was performed using HiRIEF LC-MS of triplicate control and 24 h gefitinib samples and duplicate 2 h and 6 h samples. The profiling experiments resulted in quantification of 13 486 genes at mRNA level and 10,138 genes at protein level, with an overlap of 9782 genes. For additional details see materials and methods. B, Volcano plots indicating results from mRNA-level differential expression analysis performed at different timepoints after gefitinib treatment. Green dotted lines indicate the cutoffs used to define regulated mRNAs (log2 FC>±1, adjusted p value<0.01). Indicated in each plot is also the number of upregulated and downregulated mRNAs. C, Volcano plot indicating results from protein-level differential analysis comparing 24 h gefitinib treated samples to control samples. Green dotted lines indicate the cutoffs used to define regulated mRNAs (log2 FC>±0.5, adjusted p value<0.01). Indicated in the plot is also the number of upregulated and downregulated proteins.

