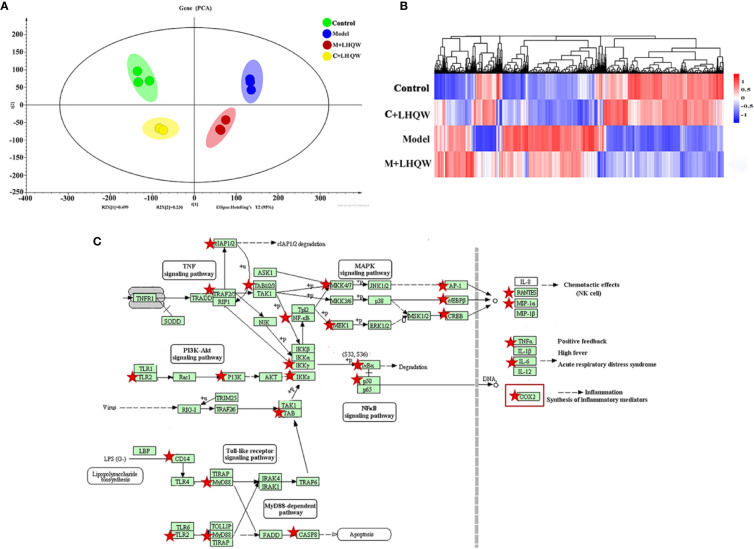
Figure 3.
The analysis of differential expression genes and pathways by cell transcriptomics as LHQW treatment. RAW264.7 cells were divided into four groups including the control, the model, the control + LHQW (C + LHQW) and the model + LHQW (M + LHQW). Model was made with1 μg/ml LPS and 0.2 μg/ml IFN-gamma. C + LHQW and M + LHQW groups were co-treated with 400 μg/ml LHQW cultured for 24 h. Total RNA from cells was isolated and sequenced. (A) PCA scores plot of comparing control, model, C + LHQW and M + LHQW groups for cell differential expression genes. (B) Heatmap of genes expression showed the variation trend among the four groups. (C) Comprehensive pathway analysis of differential expression genes by cell transcriptomics. Red stars represented genes closely related to the effect of LHQW anti-inflammation, and COX-2 as one of the most downstream targets coincide with the above metabolomics results.

