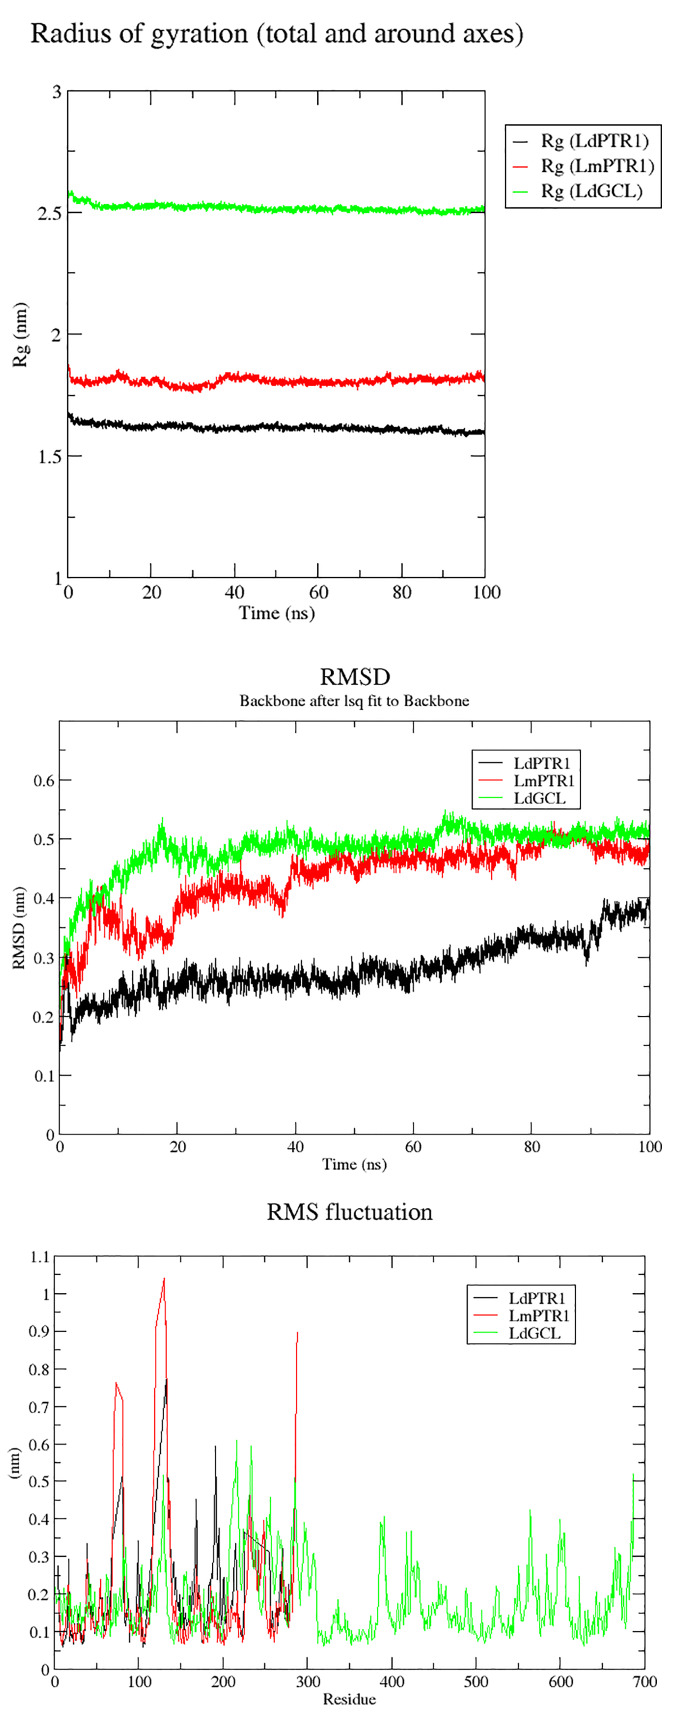
Figure 7.
Rg, RMSDs and RMSFs plots for the protein–hardwickiic acid complex MDs undertaken in 100 ns: (A) Rg plots of the three proteins in complex with hardwickiic acid. (B) The plot of RMSDs over 100 ns for the three complexes. (C) RMS Fluctuations (RMSFs) of amino acid residues pertaining to the three proteins in complex with hardwickiic acid. LdPTR1, LmPTR1, and LdGCL complexes are illustrated as black, red, and green colors, respectively.

