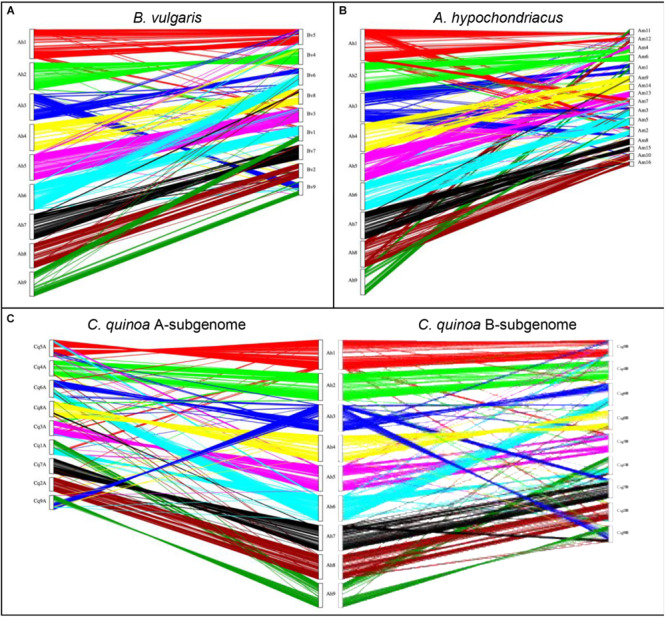
FIGURE 4.

Genomic comparison of A. hortensis with B. vulgaris, A. hypochondriacus, and C. quinoa. The dual synteny plots show syntenic regions between A. hortensis and B. vulgaris (A), A. hypochondriacus (B) and C. quinoa (C) coding sequences. The dual synteny plot of the C. quinoa genome is divided into A- and B-subgenomes with A. hortensis in the center.
