
Figure 1.
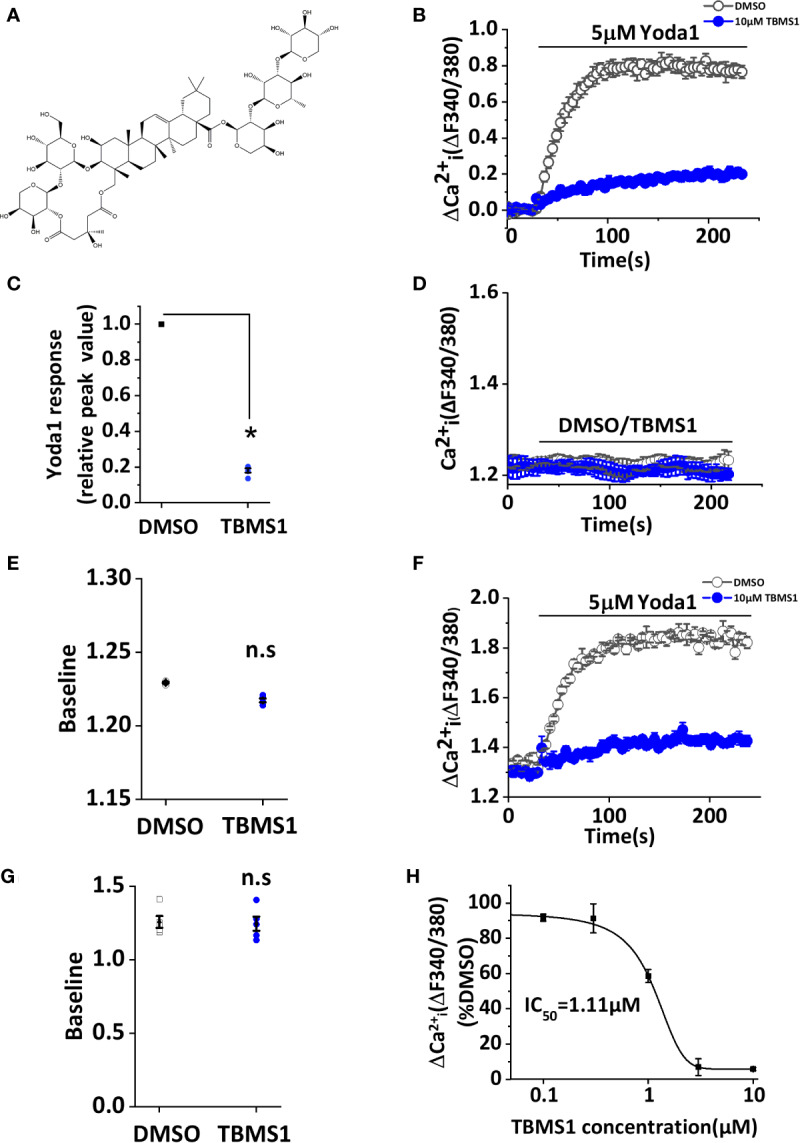
Tubeimoside I (TBMS1) inhibits Yoda1-induced Piezo1 activity. (A) Chemical structure of TBMS1. (B) Intracellular Ca2+ responses of human umbilical vein endothelial cell (HUVECs) to 5 μM Yoda1 after the cells were pretreated for 30 min with 10 μM TBMS1 or DMSO. Error bars indicate SEM (N = 16 each). (C) Summary of the results presented in (B) expressed as a percentage of the cell response to Yoda1 after cells were pretreated with TBMS1 or DMSO. Error bars indicate SEM (n = 5). (D) Intracellular Ca2+ measurements in HUVECs when direct application of 10 μM TBMS1 or DMSO only. Error bars indicate SEM (N = 8 each). (E) Mean data for the results shown in (C) (n = 5). (F) Intracellular Ca2+ responses of HUVECs to 5 μM Yoda1 after the cells were pretreated for 30 min with 10 μM TBMS1 or DMSO with original baseline. Error bars indicate SEM (N = 16 each). (G) Mean data for baseline differences of the results shown in (F) (n = 5). (H) Mean data of the results shown in (A) in which cells were pretreated with the indicated concentrations of TBMS1. Fitting the curve to the Hill equation yields an IC50 of 1.11 μM (n=5). *P < 0.05.