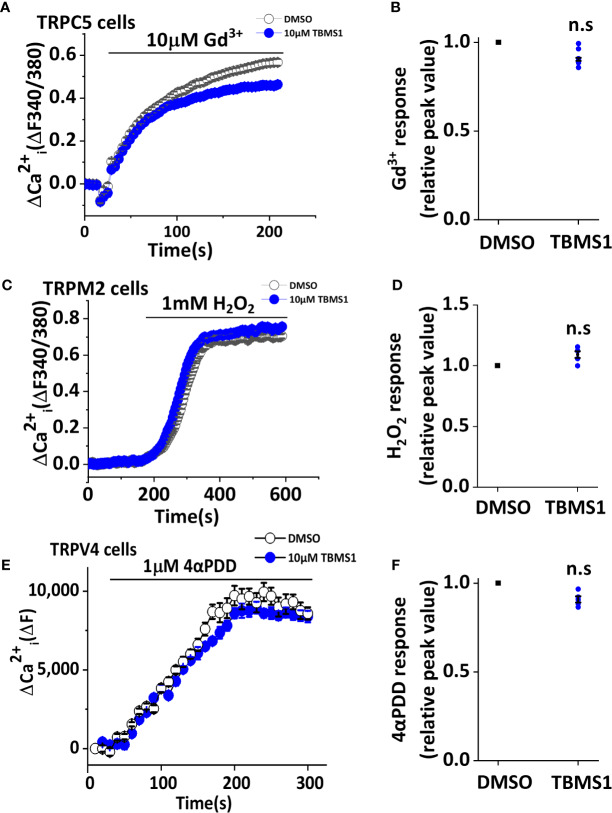
Figure 3.
Tubeimoside I (TBMS1) has selectivity of Piezo1. (A, C) Intracellular Ca2+ measurements in HEK 293T cells overexpressing TRPC5 and TRPM2 channels treated with DMSO or 10 μM TBMS1 and exposed to 10 μM Gd3+ (A) or 1 mM H2O2 (C). Error bars indicate SEM (N = 8 each). (B, D) Summary of the results shown in (A, C), data were normalized to the peak amplitude values after treatment of cells with DMSO. Error bars representing SEM (n = 5). *P < 0.05. (E) Intracellular Ca2+ measurements in CHO K1 cells overexpressing TRPV4 channels treated with DMSO or 10 μM TBMS1 and exposed to 1 μM 4αPDD. Error bars indicate SEM (N = 16 each). (F) Summary of the results shown in (E), data were normalized to the peak amplitude values after treatment of cells with DMSO. Error bars representing SEM (n = 5). *P < 0.05.

