Figure 4.
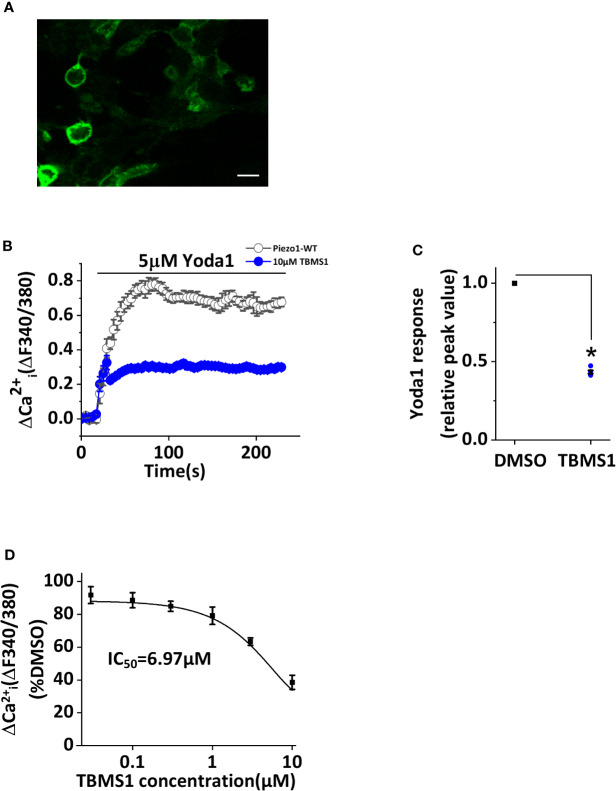
Inhibition by Tubeimoside I (TBMS1) in cells overexpressing wild-type Piezo1. (A) HEK 293T cells were transfected to express exogenous Piezo1 tagged with green fluorescent protein (GFP) (scale bar, 100 μm). (B) Intracellular Ca2+ measurements of transfected cells exposed to 5 μM Yoda1 after cells were pretreated with 10 μM TBMS1 or DMSO. Error bars indicate SEM (N = 24 each). (C) Summary of the results in (B) expressed as a percentage of the peak amplitude value after cell pretreatment with DMSO. Error bars represent SEM (n = 5). *P < 0.05. (D) Mean data of the results shown in (B) in which cells were pretreated with the indicated concentrations of TBMS1. Fitting the curve to the Hill equation yields an IC50 of 6.97 μM (n=5). *P < 0.05.

