Figure 3.
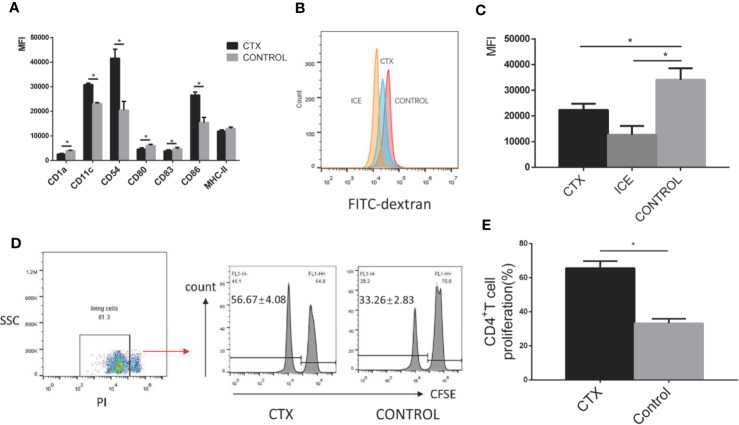
Alterations in the surface marker expression profile, antigen uptake and CD4+ T cell priming capacity of CTX-treated imDCs in vitro. (A) The quantitative results of imDC surface marker expression. (B) Detection of antigen uptake capacity of imDCs cultured at 37°C for 1 h in the presence of FITC-dextran by flow cytometry. (C) The quantitative result of antigen uptake capacity of CTX-treated imDCs. (D) The antigen presentation capacity of CTX-treated imDCs assessed by inducing CFSE-labeled CD4+ T cell proliferation in an MLR assay. (E) The quantitative result of antigen presentation capacity of CTX-treated imDCs. Dead cells were excluded from analysis based on PI fluorescence. Error bars indicate the SEM. *P < 0.05, compared with the control group. All values represent the mean ± SEM of three independent experiments.

