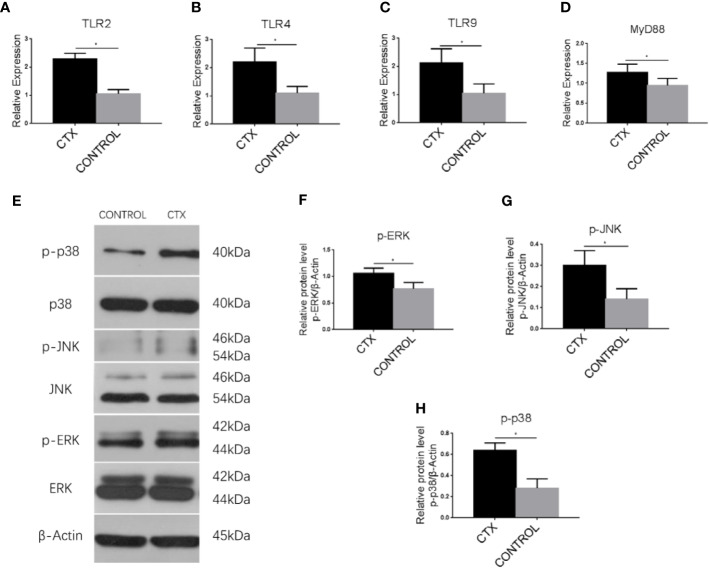
Figure 5.
Enhanced expression of TLRs, MyD88, and MAPK pathway-associated signaling components in imDCs in response to CTX. (A–D) RT-qPCR analysis of TLR2, TLR4, TLR9, and MyD88 mRNA expression in imDCs. (E–H) Western blotting analysis of p38, p-p38, JNK, p-JNK, ERK, and p-ERK protein expression in imDCs. Error bars indicate the SEM. *P < 0.05, compared with the control group. All values represent the mean ± SEM of three independent experiments.

