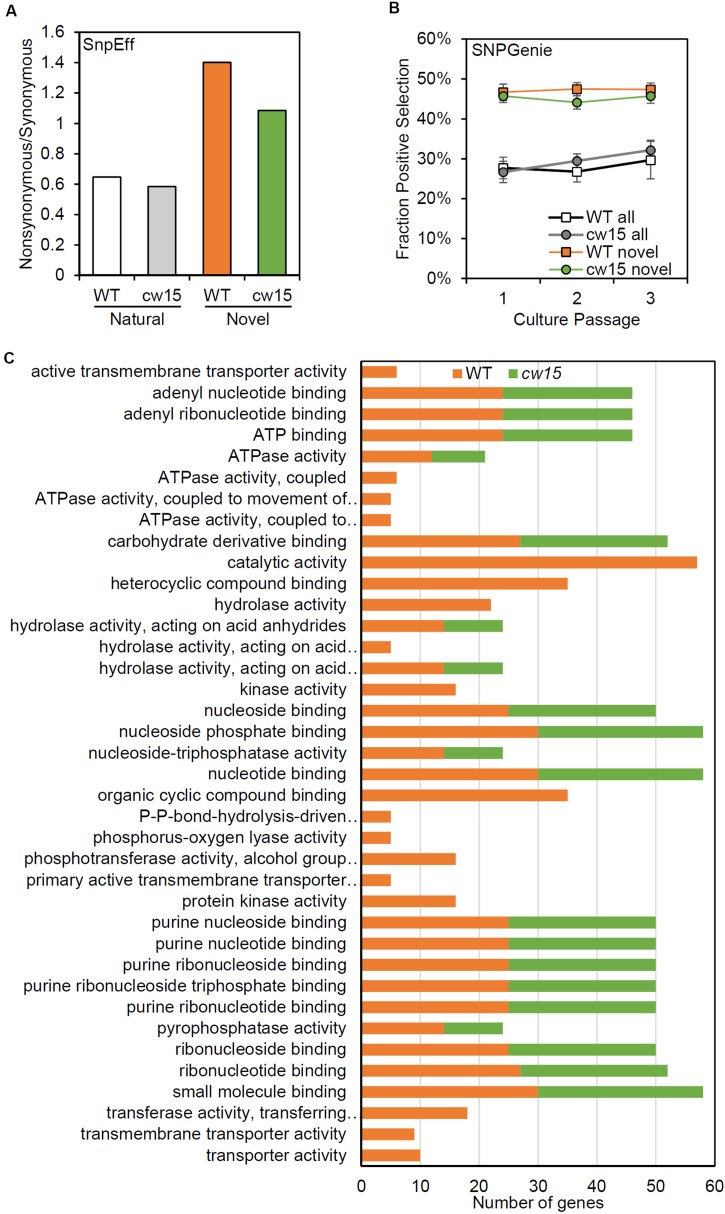
FIGURE 7.
Novel variants are enriched for predicted protein coding changes. (A) Ratio of non-synonymous to synonymous variants based on SnpEff annotations. White and gray show natural variants detected. Orange and green show novel variants. (B) Average fraction of genes showing positive selection of all genes tested with SNPGenie. Averages are from six libraries per passage. Error bars are standard deviations. (C) Enriched GO terms for genes with positive selection.

