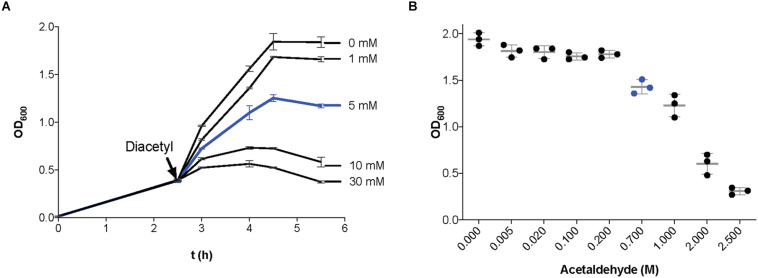
FIGURE 1.
Effect of the presence of diacetyl and acetaldehyde on Lactococcus lactis growth. (A) Growth curves (optical density at 600 nm; OD600) of bacterial cultures in GM17. When the cultures reached an OD600 = 0.4 (black arrow), incubation continued in the presence of different concentrations of diacetyl (1–30 mM). A concentration of 5 mM diacetyl (line in blue) was used for transcriptome analysis. (B) Final optical density at 600 nm of L. lactis cultures incubated in GM17 in the presence of different concentrations of acetaldehyde (0.005–2.5 M). A concentration of 0.7 M acetaldehyde (blue dots) was used for transcriptome analysis. Data are presented as mean ± SD. Error bars represent standard deviation (SD) of the mean values of three independent experiments.

