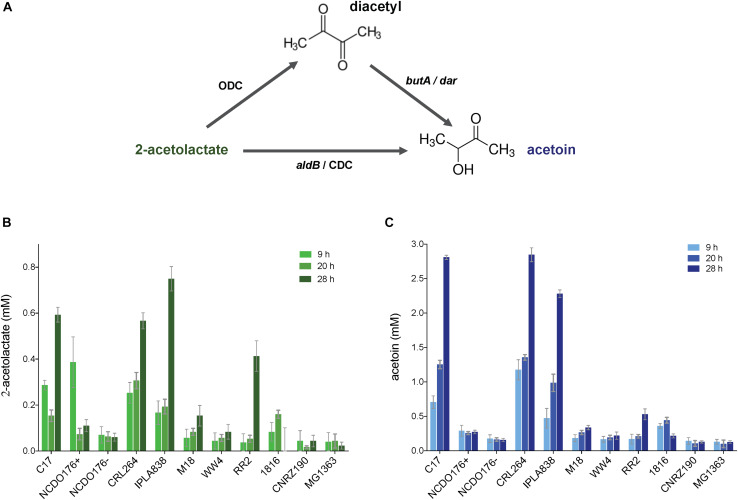
FIGURE 6.
Quantification of pyruvate metabolites (2-acetolactate and acetoin) in L. lactis subsp. lactis biovar diacetylactis strains. (A) 2-acetolactate can be converted into diacetyl and acetoin; diacetyl can be reduced into acetoin. (B,C) concentration of 2-acetolactate (plot with bars in green) and acetoin (plot with bars in blue) in bacterial supernatants, respectively. Concentrations of the compounds were obtained at three different incubation times (light color to dark color; 9, 20, and 28 h). The L. lactis subsp. cremoris MG1363 was included in this analysis as a control strains. Data are presented as mean ± SD. Error bars represent standard deviation (SD) of the mean values of three independent experiments (see section “Materials and Methods”).

