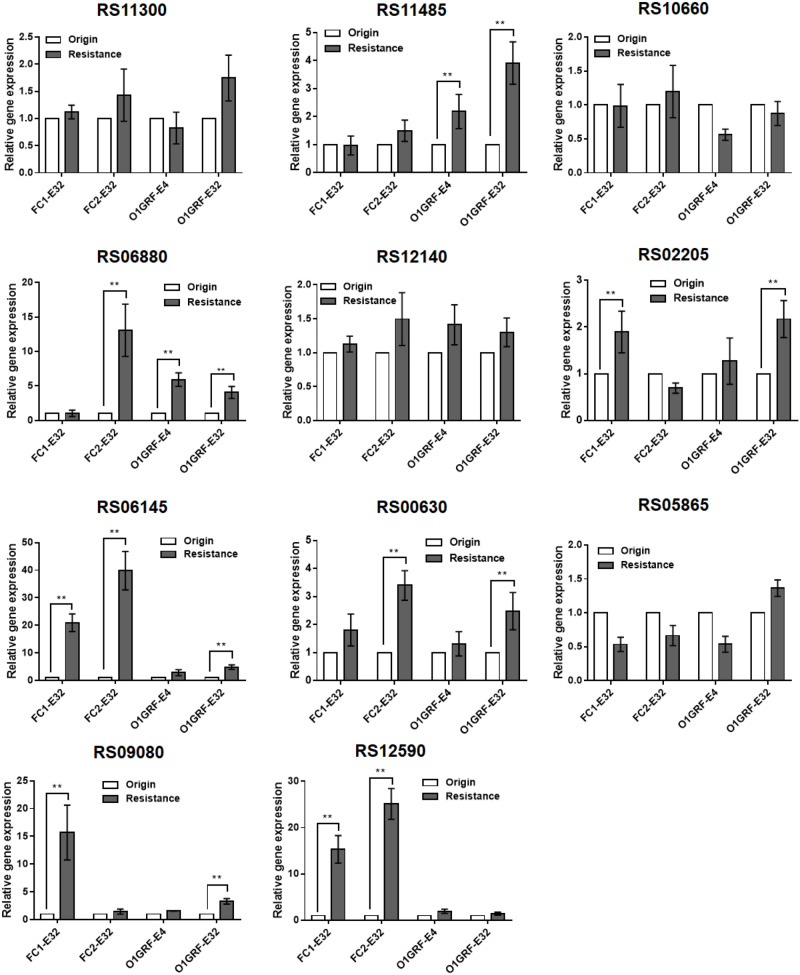
FIGURE 1.
Correlation between transcript levels of 11 candidate genes and Erava-induced resistance in E. faecalis isolates. Transcript levels were determined by qRT-PCR, with the housekeeping gene recA serving as an internal control. The original (wild-type) strain was used as the reference (expression = 1.0). The Y axis represents relative fold change compared to the reference. Resistance, the expression level of corresponding gene in the resistant strain; origin, the expression level of corresponding gene in the origin strain. Resistant isolates and the reference strain are shown in Table 4. Data represent mean ± SD of three technical repeats. **P < 0.01 (Student’s t-test).

