
FIGURE 2.
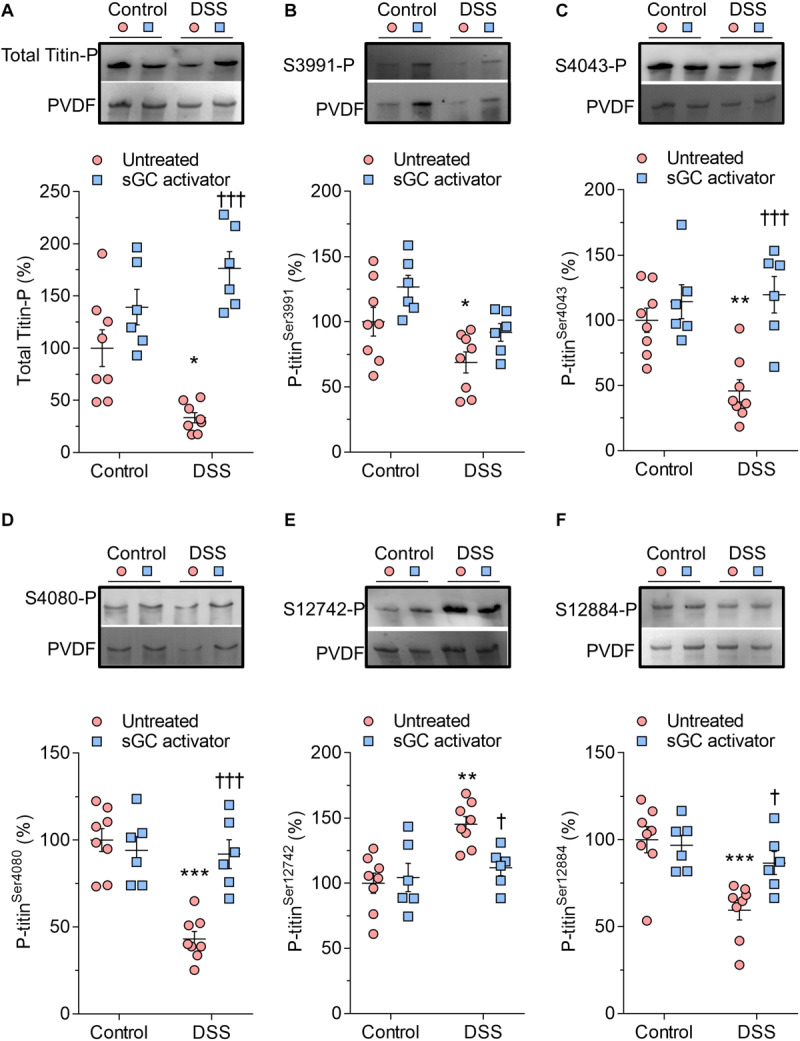
Titin phosphorylation in Dahl salt-sensitive (DSS) and control rats. (A) Total titin phosphorylation. (B) Phospho (P) site-specific within titin-N2Bus at Ser3991. (C) P site-specific within titin-N2Bus at Ser4043. (D) P site-specific within titin-N2Bus at Ser4080. (E) P site-specific within titin PEVK segment at Ser-12742. (F) P site-specific within titin PEVK segment at Ser-12884. Data are shown as mean ± SEM; n = 7–8 left ventricular (LV) samples/group. *P < 0.05, **P < 0.001, ***P < 0.0001 control untreated versus DSS untreated and †P < 0.05, †††P < 0.0001 before versus after soluble guanylyl cyclase (sGC) activator treatment.