
FIGURE 4.
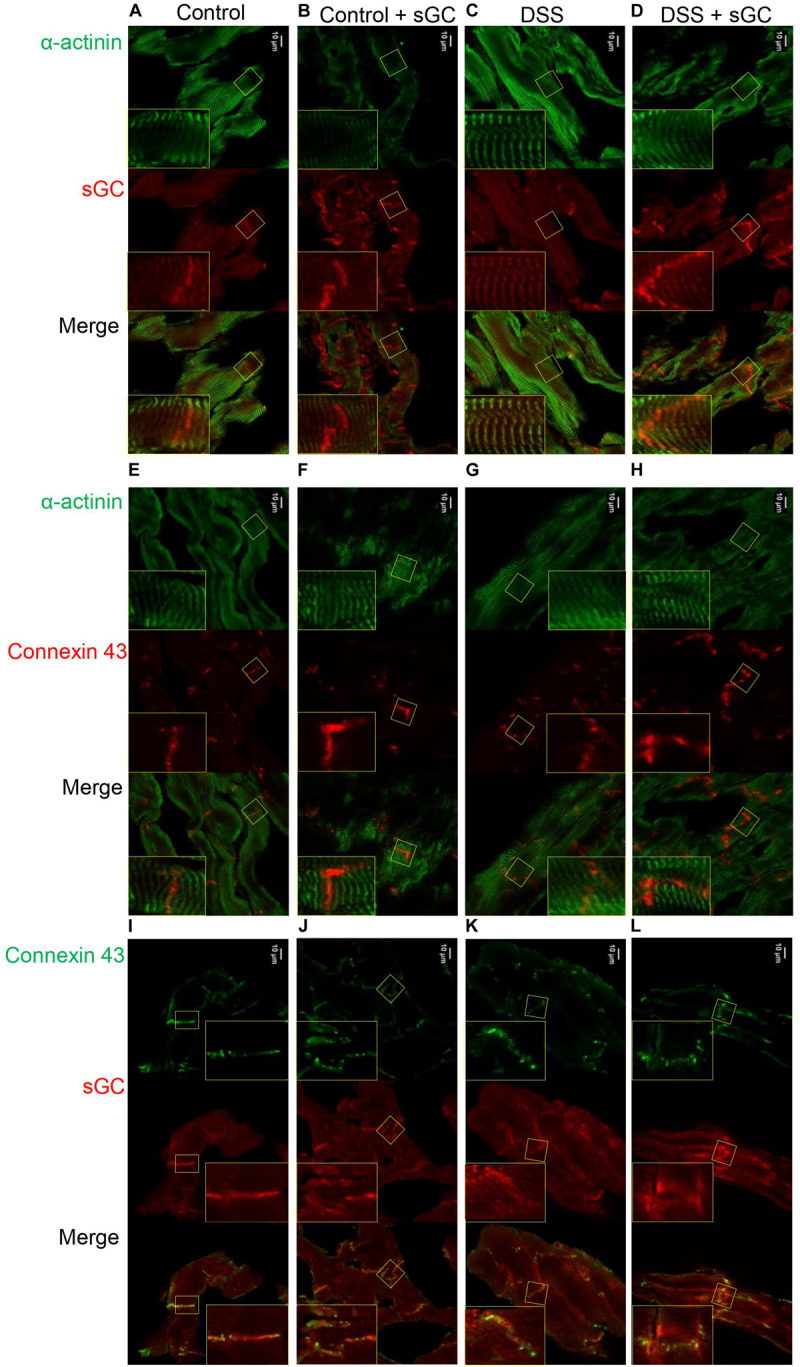
cLSM images of control and DSS rat cardiomyocytes before and after sGC activator treatment demonstrating sGC translocation to the intercalated disc (A–D). Representative immunofluorescence images of cardiomyocytes stained for cardiac sGC (red) and counterstained for α-actinin (green). (E–H) Immunofluorescence images of cardiomyocytes stained for connexin 43 (red) and counterstained for α-actinin (green). (I–L) Representative immunofluorecence images of cardiomyocytes stained for connexin 43 (green) and sGC (red).